Download

1 / 56
560 likes | 686 Views
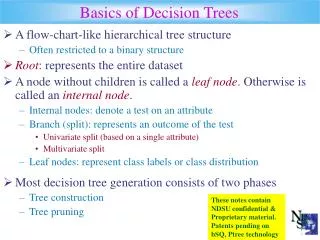
Induction of Decision Trees Using Genetic Programming for the Development of SAR Toxicity Models. Xue Z Wang. TOXICITY values are not known !!!. The Background. 26 million distinct organic, inorganic chemicals known > 80, 000 in commercial production.

E N D
Induction of Decision Trees Using Genetic Programming for the Development of SAR Toxicity Models Xue Z Wang
TOXICITY values are not known !!! The Background 26 million distinct organic, inorganic chemicals known > 80, 000 in commercial production Combinatorial chemistry adds more than 1 million new compounds to the library every year In UK, > 10,000 are evaluated for possible production every year Biggest cost factor
What is toxicity? • "The dose makes the poison” - Paracelsus (1493-1541) • Toxicity Endpoints: EC50, LC50,… …
Toxicity tests are expensive, time consuming and disliked by many people In Silico Toxicity Prediction: SAR & QSAR - (Quantitative) Structure Activity Relationships TOPKAT, DERECK, MultiCase
Molecular weight HOMO LUMO Heat of formation Log D at pH 2, 7.4, 10 Dipole moment Polarisability Total energy Molecular volume ... Daphnia magna EC50 Cancinogenicity Mutagenicity Rat oral LD50 Mouse inhalation LC50 Skin sensitisation Eye irritancy DESCRIPTORS Physcochemical, biological, structural Molecular Modelling SAR & QSARs Toxicity Endpoints e.g. Neural Networks PLS, Expert Systems HOMO - highest occupied molecular orbital LUMO - Lowest unoccupied molecular orbital No of descriptors cost time
Aims of Research integrated data mining environment (IDME) for in silico toxicity prediction decision tree induction technique for eco-toxicity modelling in silico techniques for mixture toxicity prediction
Users own data resources, often commercially sensitive, not fully exploited Why Data Mining System for In Silico Toxicity Prediction Existing systems: • Unknown confidence level of prediction • Extrapolation • Models built from small datasets • Fixed descriptors • May not cover the endpoint required
More importantly Better understanding Data Mining:Discover UsefulInformation and Knowledge from Data Value Data: records of numerical data, symbols, images, documents Decision Knowledge: Rules: IF .. THEN .. Cause-effect relationships Decision trees Patterns: abnormal, normal operation Predictive equations …… Knowledge Information Data Data Data Data Volume The non-trivial process of identifying valid, novel, potentially useful, and ultimately understandable patterns in data
Clustering Classification Conceptual Clustering Inductive learning Dependency modelling Summarisation Regression Case-based Learning
eg. Dependency Modelling or Link Analysis x1 x2 x3 1 0 0 1 1 1 0 0 1 1 1 1 0 0 0 0 1 1 1 1 1 0 0 0 1 1 1 0 0 0 x1 x2 x3 x2 x1 x3
Data pre-processing - Wavelet for on-line signal feature extraction and dimension reduction - Fuzzy approach for dynamic trend interpretation Clustering - Supervised classification - BPNN - Fuzzy set covering approach Unsupervised classification - ART2 (Adaptive resonance theory) - AutoClass - PCA Dependency modelling - Bayesian networks - Fuzzy - SDG (signed directed graph) - Decision trees Others - Automatic rules extraction from data using Fuzzy-NN and Fuzzy SDG - Visualisation
Modern control systems Cost due to PREVENTABLE abnormal operations: e.g. $20 billion per year in pretrochemical ind. Fault detection & diagnosis: very complex sensor faults, equipment faults, control-loop, interaction of variables …
Start point End point Yussel’s work Process Operational Safety Envelopes Loss Prevention in Process Ind. 2002
Descriptor calculation • Data Mining Toolbox • Regression • PCA & ICA • ART2 networks • Kohonen networks • K-nearest neighbour • Fuzzy c-means • Decision trees and rules • Feedforward neural networks (FFNN) • Summary statistics • Visualisation • Data Pre-processing • Scaling • Missing values • Outlier identification • Feature extraction • Discovery Validation • Statistical significance • Results for training and test sets • Data import • Excel • ASCII Files • Database • XML • Results Presentation • Graphs • Tables • ASCII files Integrated Data Mining Environment - Toxicity
75 organic compounds with 1094 descriptors and endpoint Log(1/EC50) to Vibrio fischeri Zhao et al QSAR 17(2) 1998 pages 131-138 Log(1/EC50) = -0.3766 + 0.0444 Vx (r2 0.7078, MSE 0.2548) Quantitative Structure Activity Relationship Vx – McGowan’s characteristic volume r2 – Pearson’s correlation coefficient q2 – leave-one out cross validated correlation coefficient
Feedforward neural networks Input layer Hidden layer Output layer PC1 PC2 PC3 … Log(1/EC50) PCm
QSAR Mode for Mixture Toxicity Prediction Similar Constituents TESTING Dissimilar Constituents Similar Constituents TRAINING Dissimilar Constituents
Lack of knowledge on what descriptors are important to toxicity endpoints (feature selection) Expert systems: subjective knowledge obtained from human experts Linear vs nonlinear Black box models Why Inductive Data Mining for In Silico Toxicity Prediction ?
What is inductive learning? Aims at Developing a Qualitative Causal Language for Grouping Data Patterns into Clusters Decision trees or production rules Explicit and transparent
Inductive DM • Combines adv. of ESs, and SMs & NNs • Qualitative & quantitative, nonlinear • Data & human knowledge used • Knowl. transparent and causal • More research • Continuous valued output • Dynamics / interactions Expert Systems Knowl. Subjective. Data not used Often qualitative • Human expert knowl. • Knowl. transparent, causal Statistical Methods • Data driven • Quantitative Black-box Human knowl. not used Neural Networks • Data driven • Quantitative • Nonlinear • Easy setup Black-box Human knowl. not used
Discretization techniques Methods Tested C5.0 Binary discretization Information entropy (Quinlan 1986 & 1993) C5.0 LERS (Learning from Examples using Rough Sets, Grzymala-Busse 1997) LERS_C5.0 Probability distribution histogram Histogram_C5.0 Equal width interval EQI_C5.0 KEX_chi_C5.0 KEX_fre_C5.0 KEX_fuzzy_C5.0 KEX (Knowledge EXplorer, Berka & Bruha 1998) CN4 (Berka & Bruha 1998) CN4_C5.0 Chi2 (Liu & Setiono 1995, Kerber 1992) Chi2_C5.0
Decision Tree Generation Based on Genetic Programming Traditional Tree Generation methods– Greedy search, can miss potential models Genetic Algorithm– optimisation approach can effectively avoid local minima and simultaneously evaluate many solutions GA has been used in decision tree generation to decide the splitting points and attributes to be used whilst growing a tree Genetic (evolutionary) Programming : Not only simultaneously evaluate many solutions and avoid local minima But does not require parameter encoding into fixed length vectors called chromosomes Based on direct application of the GA to tree structures
Genetic Computation • Generation of a population of solutions • Repeat steps (i) and (ii) until the stop criteria are • satisfied • (i) calculate the fitness function values for each • solution candidate • (ii) perform crossover and mutation to generate • the next generation • the best solution in all generations is regarded as • the solution
Crossover Genetic algorithms Genetic (Evolutionary) Programming / EPTree + + = =
1. Divide data into training and test sets 2. Generate the 1st population of trees - randomly choosing a row (i.e. a compound), and column (i.e. descriptor) - Using the value of the slot, s, to split,left child takes those data points with selected attribute values <= s, whilst the right child takes those > s. Descriptors Molecules <s >s DeLisle & Dixon J Chem Inf Comput Sci 44, 862-870 (2004) Buontempo & Wang et al, J Chem Inf Comput Sci 45, 904-912 (2005)
If a child will not cover enough rows (e.g. 10% of • the training rows), another combination is tried. • - A child node becomes a leaf node if pure i.e. all the • rows covered are in the same class, or near pure, • whilst the other nodes grow children • When all nodes either have two children or are leaf • nodes, the tree is fully grown and added to the first • generation. • A leaf node is assigned to a class label • corresponding to the majority class of points • partitioned there.
3. Crossover, Mutation - Tournament: randomly select a groups of trees e.g. 16 - Calculate fitness values - Generate the first parent - Similarly generate the second parent - Crossover to generate a child - Generate other children - Select a percentage for mutation + =
Mutation Methods • Random choice of change of split point (i.e. choosing • a different row’s value for the current attribute) • Choosing a new attribute whilst keeping the same row • choosing a new attribute and a new row • re-growing part of the tree • If no improvement in accuracy for k generations, trees • generated were mutated • - … …
Two Data Sets Data Set 1: Concentration lethal to 50% of the population, LC50, 1/Log(LC50), of vibrio fischeri, a biolumininescent bactorium 75 compounds 1069 molecular descriptors Data Set 2: Concentration effecting 50% of the population, EC50 of algae chlorella vulgaris, by causing fluorescein diacetate to disappear 80 compounds 1150 descriptors
600 trees were grown in each egneration 16 trees competing in each tournament to select trees for crossover, 66.7% were mutated for the bacterial dataset, and 50% mutated for the algae dataset.
Cl attached to C2 (sp3) ≤ 1 No Yes Highest eigenvalue of Burden matrix weighted by atomic mass ≤ 2.15 Self-returning walk count of order 8 ≤ 4.048 Yes No Yes No Class 1 (12/12) Class 3 (8/8) Lowest eigenvalue of Burden matrix weighted by van der Waals vol ≤ 3.304 Class 4 (7/7) Yes No Class 4 (5/6) Distance Degree Index ≤ 15.124 No Yes Class 4 (5/6) Summed atomic weights of angular scattering function ≤ ‑1.164 Yes No Class 2 (5/6) R autocorrelation of lag 7 weighted by atomic mass ≤ 3.713 Yes No Class 3 (6/7) Class 2 (7/8) Evolutionary Programming Results: Dataset 1 For data set 1, bacteria data in generation 37 91.7% for training (60 cases) 73.3% for the test set (15 cases)
Decision Tree Using C5.0 for the Same Data For data set 1, bacteria data 88.3% for training (60 cases) 60.0 % for test set (15 cases) Gravitational index ≤ 7.776 Yes No Valence connectivity index ≤ 3.346 Class 1 (13/14) Yes No Class 4 (14/15) Cl attached to C1 (sp2) ≤ 1 Yes No H Autocorrelation lag 5 weighted by atomic mass ≤ 0.007 Class 3 (7/7) Yes No Class 4 (3/6) Summed atomic weights of angular scattering function ≤‑0.082 Yes No Class 3 (5/6) Class 2 (11/12)
Evolutionary Programming Results: Dataset 2 Solvation connectivity index ≤ 2.949 No Yes Self-returning walk count order 8≤ 3.798 Molecular multiple path count order 3 ≤ 92.813 Yes No Yes No Class 2 (14/15) Class 1 (16/16) Class 3 (6/8) H autocorrelation of lag 2 weighted by Sanderson electro-negativities ≤ 0.401 Yes No 2nd dataset - algae data GP Tree, generation 9 Training: 92.2% Test: 81.3% Class 4 (6/7) 2nd component symmetry directional WHIM index weighted by van der Waals volume ≤ 0.367 No Yes Class 4 (8/8) Class 3 (9/10)
Decision Tree Using See5.0 for the Same Data Max eigenvalue of Burden matrix weighted by van der Waals vol ≤ 3.769 No Yes Broto-Moreau autocorrelation of topological structure lag 4 weighted by atomic mass ≤ 9.861 Class 1 (16/16) Yes No Class 2 (15/16) Total accessibility index weighted by van der Waals vol ≤ 0.281 2nd dataset, algae data See 5, Training: 90.6% Test: 75.0% No Yes Class 4 (12/12) Class 3 (15/20)
Data set 2 – Algae data C5.0 GP method 4 90.6% 75.0% 6 92.2% 81.3% Tree size Training Accuracy Test Accuracy Summary of Results Data set 1 – Bacteria data C5.0 GP method 6 88.3% 60.0% Tree size Training Accuracy Test Accuracy 8 91.7% 73.3%
Data Set 2 – Algae data C5.0 GP (Generation 9) 4 90.6% 75.0% 6 90.6% 87.5% Tree size Training Accuracy Test Accuracy Comparison of Test Accuracy for See5.0 and GP Trees Having the Same Training Accuracy Data Set 1 – Bacteria data C5.0 GP (Generation 31) 6 88.3% 60.0% Tree size Training Accuracy Test Accuracy 8 88.3% 73.3%
Primary Treatment Secondary Treatment Screening Grit Removal Inflow Primary Settler Aeration Tank Outflow Secondary Settler Application to Wastewater Treatment Plant Data
Data Corresponding to 527 Days’ Operation 38 Variables Aeration Tanks Primary Settler Screws Output Input Secondary Settler Primary Treatment Pre-Treatment Secondary Treatment Sludge Line
Decision tree for prediction of suspended solids in effluents – training data SS-P ≤ -2.9572 SS-P ≤ -1.8445 DQO-D ≤ 1.80444 SS-P ≤ -1.68597 DBO-D ≤ 0.47006 RD-DBO-G ≤ 0.8097 PH-D ≤ 0.8699 N 20 L 2 PH-D ≤ 0.59323 SS-P ≤ -3.167930 N 5 DQO-D ≤ 2.53335 SS-P ≤ -1.58468 SSV-P ≤ 0.17786 N 7 N 320/1 N 11 N 2 SS-P ≤ -3.6479 N 3 H 4 N 16 ZN-E≤ 2.2447 L 3 N 3 DBO-SS ≤ 0.81806 N 30 PH-D ≤ 0.65534 H 2 PH-D ≤ 0.68569 N 2 SS-P ≤ -1.20793 N 27 L 3 N 4 RD-DQO-S ≤ 0.31152 Total No of Obs. =470 Training Accuracy: 99.8% Test Accuracy: 93.0% Leaf Nodes = 20 L = Low N = Normal H = High SS-P : input SS to primary settler DQO-D : input COD to secondary settler DBO-D : input COD to secondary settler PH-D : input pH to secondary settler SSV-P : input volatile SS to primary settler N 3 H 3
DBO-E ≤ 0.49701 Using all the data of 527 days N 76/3 SS-P ≤ -1.86019 SS-P ≤ -1.86017 SS-P ≤ -3.08361 N 13 RD-SS-P ≤ 0.491144 RD-DQO-S ≤ 0.35794 RD-SS-G≤0.50018 N 11 DBO-D ≤ 0.408557 SS-P ≤ -1.20793 RD-DQO-S ≤ 0.357935 N 69 SED-P ≤-2.81193 H 9 PH-P ≤ 0.41833 N 234/1 N 2 DBO-E ≤0.71809 L 3 N 25 PH-D ≤ 0.65537 SS-P ≤ -3.39768 L 2 N 31 COND-S ≤ 0.49438 N 8 PH-P ≤ 0.17333 No of Obs. = 527 Accuracy = 99.25% Leaf Nodes = 18 L = Low N = Normal H = High L 3 N 4 L 3 H 3 N 20 N 11
An Integrated Data Mining Prototype System for Toxicity Prediction of Chemicals and Mixtures Developed An Evaluation of Current Inductive Data Mining Approaches to Toxicity Prediction Has Been Conducted A New Methodology for the Inductive Data Mining Based Novel Use of Genetic Programming is Proposed, Giving Promising Results in Three Case Studies Final Remarks
On-going Work • Adaptive Discretization of End-point Values through • Simultaneous Mutation of the Output SSRD - sum of squared differences in rank The best training accuracy in each generation for the trees grown for the algae data using the SSRD. The 2 class trees no longer dominate and very accurate 3 class trees have been found.
Future Work 2) Extend the Method to Model Trees & Fuzzy Model Trees Generation Rule 1: If antecedent one applies, with degree μ1=μ1,1×μ1,2×…×μ1,9 then y1= 0.1910 PC1 + 0.6271 PC2 + 0.2839 PC3 + 1.2102 PC4 + 0.2594 PC5 + 0.3810 PC6 - 0.3695 PC7 + 0.8396 PC8 + 1.0986 PC9 - 0.5162 Rule 2: If antecedent two applies, with degree μ2=μ2,1×μ2,2×…×μ2,9 then y2 = 0.7403 PC1 + 0.5453 PC2 - 0.0662 PC3 - 0.8266 PC4 + 0.1699 PC5 - 0.0245 PC6 + 0.9714 PC7 - 0.3646 PC8 - 0.3977 PC9 - 0.0511 Final output: Crisp value (μ1×y1 + μ2×y2) / (μ1 + μ2) where μi=μi,1×μi,2×……×μi,10