Solving Problems in SPSS
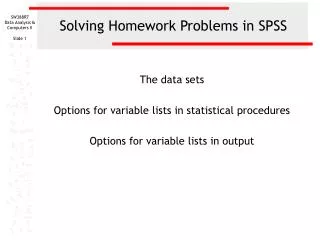
Solving Problems in SPSS. The data sets Options for variable lists in statistical procedures Options for variable lists in output. The data sets.

Solving Problems in SPSS
E N D
Presentation Transcript
Solving Problems in SPSS The data sets Options for variable lists in statistical procedures Options for variable lists in output
The data sets • The homework problems will state the data set that they are using, generally using a data set called GSS2000.SAV, a subset of cases and variables from the 2000 General Social Survey. • The data set contains 270 cases and 254 variables. All of the cases show "Scale" for level of measurement, instead of the correct level of measurement. • There are some options in SPSS that make it easier for you to identify the correct variable to include in an analysis and identify in the output.
Problem statements A homework problem statement will look like the following: • Part of your task in solving this problem in SPSS will be to identify which variable contains the information on employment status, number of hours worked, etc. • The resources available to you are the variable name mnemonic, the variable label, and the GSS codebook which can be downloaded from the data files web page. • Once you identify the variable name, you will have to locate it in the long list of variables in the procedure dialogs. The following are suggestions to make this task more doable. Based on a missing data analysis for the variables "employment status," "number of hours worked in the past week," and "self employment" in the dataset GSS2000.sav, is the following statement true, false, or an incorrect application of a statistic? The variables "number of hours worked in the past week" is missing data for more than half of the cases in the data set and should be examined carefully before deciding how to handle missing data.
Selecting options To change the display options in SPSS for either input dialog boxes or the display of output, select Options… from the Edit menu.
The options dialog box The Variable Lists panel supports for different combinations for the way variables appear in the lists in dialog boxes. We can choose to have variables listed in alphabetical order or in the order that they appear in data file as displayed in the data editor We can choose to display the variable labels or the variable names. My personal preference is to display names in file order, but you should pick the one that facilitates your work.
Input dialog with file order variable names With the choice of variable names in file order, the lists of variables in the dialog boxes follow the same order as the data set.
Setting the order to alphabetical To choose to show the variable names in alphabetical order, first click on the Alphabetical option button. Second, click on the Apply make the change.
SPSS's response to your change When you click on the apply button, SPSS displays this message to you about its response. Click on the OK button to confirm your choice.
Completing the change Click on the OK button in the Options dialog box to complete your request for a change.
Input dialog with alphabetized variable names With the choice of variable names in alphabetical order, the lists of variables in the dialog boxes is displayed in alphabetical order.
Displaying variable labels instead of names To choose to show the variable labels in alphabetical order, click on the Display labels option button and click on the Alphabetical option button. Second, click on the Apply make the change.
Input dialog with alphabetized variable labels With the choice of variable labels in alphabetical order, the lists of variables in the dialog boxes is displayed in alphabetical order. To see the full label, hover the mouse pointer over the item.
Displaying variable labels in file order To choose to show the variable labels in file order, click on the Display labels option button and click on the File option button. Second, click on the Apply make the change.
Input dialog with file order variable labels With the choice of variable labels in file order, the lists of variables in the dialog boxes are displayed in file order. To see the full label, hover the mouse pointer over the item.
Output variable labeling options To see the output labeling options, click on the Output Labels tab in the Options dialog. We can choose what appears in the navigator outline as well as the pivot tables which hold statistical results. We can choose the labeling for both variables and values. We have three choices for each: labels only, values only, and values and labels.
Table with value labels only The variable labels are used for table titles. The output tables the values labels for each category in the frequency distribution.
Choosing values instead of labels First, choose Values from the drop down menu for Variable values in labels shown as. Second, click on the Apply button to confirm our choice. Third, click on the OK button to complete the choice.
Table with values and no labels The variable labels are still used for table titles. The output tables display the values and not the value labels for each category in the frequency distribution.
Choosing values and labels for output tables First, choose Values and Labels from the drop down menu for Variable values in labels shown as. Second, click on the Apply button to confirm our choice. Third, click on the OK button to complete the choice.
Table with both values and labels The variable labels are still used for table titles. The output tables display both the values and the value labels for each category in the frequency distribution. This may be the best choice when you are first working with this data set, but it is up to you.