Download
1 / 20
210 likes | 304 Views
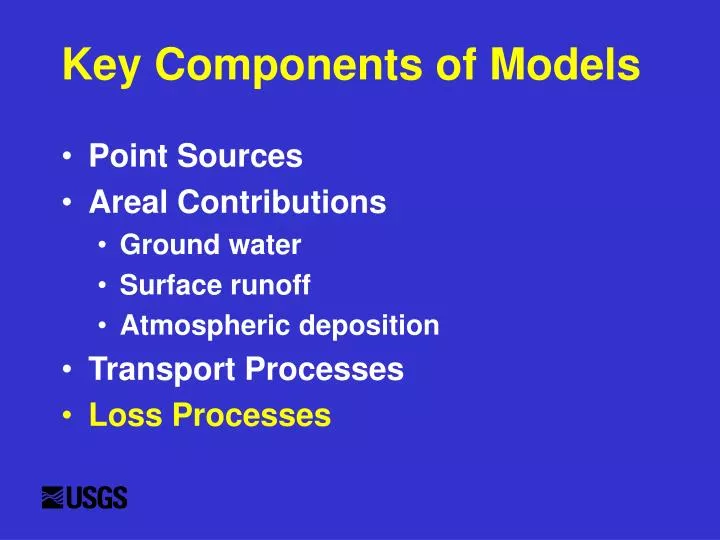
Key Components of Models. Point Sources Areal Contributions Ground water Surface runoff Atmospheric deposition Transport Processes Loss Processes. Nitrogen-loss Rate in Relation to Stream Channel Depth. Approaches to Setting Loss Coefficients. Textbook values / default values

E N D
Key Components of Models • Point Sources • Areal Contributions • Ground water • Surface runoff • Atmospheric deposition • Transport Processes • Loss Processes
Approaches to SettingLoss Coefficients • Textbook values / default values • Field-based determinations • Statistical estimation from monitoring data
SPARROW SPAtially Referenced Regressions On Watershed Attributes
Area of Hypoxic Zone, 1985-2000 Source: N.N. Rabalais, Louisiana Universities Marine Consortium, Chauvin, La.
Annual Nitrate Flux to Gulf of Mexico and Mean Annual Streamflow
River Monitoring Stations & Major Watersheds: Mississippi River Basin
Percentage of the Nitrogen Exported from Interior Watersheds that is Delivered to the Gulf
Yield of Total Nitrogen Delivered to the Gulf from Incremental Drainage areas of the Mississippi River Basin
Middle Snake River,Southern Idaho, Flow by Source Tributary Inflow 20% 66% 1% 12% Aquaculture Effluent Tributary Inflow Ground Water Discharge Upstream Inflow Sewage Treatment Effluent Irrigation Returns
Sources of Discharge, Nitrogen, & Phosphorus: Middle Snake River, 1995
Data Issues • Water quality data are expensive • Need to share existing data among agencies, groups (ACWI, NWQMC) • To be useful we need metadata on: place, time, method of collection and method of analysis • Need computer/web accessibility
Nationwide Data Availability NWIS STORET
NWIS-Web http://water.usgs.gov/nwis • 1.5 million sites (80% are wells) • 350,000 water quality sites • 19,000 streamflow sites • 5,000 real time sites • 4.3 million water quality samples • 64 million chemical analyses
STORET-USEPA • Legacy STORET: Data through 1998, data of undocumented quality • New STORET: includes metadata descriptors, now includes data from 10 States, some States adding in last 10 yrs of data not in legacy data base • Both data sets available at http://www.epa.gov/storet/index.html
Welcome to STORET, EPA's largest computerized environmental data system. STORET (short for STOrage and RETrieval) is a repository for water quality, biological, and physical data and is used by state environmental agencies, EPA and other federal agencies, universities, private citizens, and many others. Comments? If you have a question or comments on this website or on the STORET system, send us an email at STORET@epa.gov. EPA | Office of Water | Wetlands, Oceans, and Watersheds | Monitoring Water QualityLast revised November 16, 2000URL: http://www.epa.gov/storet/index.html