Download
1 / 23
230 likes | 347 Views
Resistivity of the California Wash and Astor Pass. The California Wash Astor Pass North-South Astor Pass East-West Astor Pass AP 1, 2 Conclusions. Objectives. The California Wash. N. Results and Interpretations.

E N D
The California Wash • Astor Pass North-South • Astor Pass East-West • Astor Pass AP 1, 2 • Conclusions Objectives
Results and Interpretations • Lines 1-4 show a decreasing resistivity both with depth and initial resistivity of soil • Line 5 lies higher than 1-4 and shows a higher resistivity • Depth profiles of lines 3 and 5 show inversions from layers 1, 2 and 4 • Lines 1-4 are on a downward slope of a graben which ultimately ended in a wash. Line 5 lies on top of a horst to the west of the graben. This is expected as the graben would probably collect more moisture and have a lower resistivity than the higher lying horst.
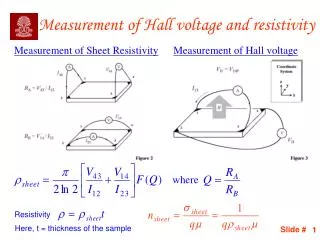
As we go across the fault E-W the resistivity goes up Considerable across the 148/160m section, interpreted To be the fault. • 101 and 196 m lines show general Q type and have a lower resistivity than the 148/160m lines indicating a build up along the fault of resistive mineralization • The 148/160m lines are interacting with the tufa, the calcification of the tufa has resulted in a decrease inresistivity in the subsurface below this line Results and Interpretations
Along the E-W sections from North-South the same results are shown as in the East-West sections the148/160m lines show increased resistivity • Comparing in this direction it is clear the differencebetween the 148/160m lines and the 101m and 196m lines • Interpreting in a different direction again shows the center 148/160m lines have increased resistivity indicating the presence of the tufa build up in the subsurface Results and Interpretations
The position is located on top of packed, non-local sediments as well as having drillwells might have interfered with readings • Results show a relatively constant resistivitydown past the 10m A spacing • Resistivities higher than near the tufa at the 101m and 196m • The data shows little change in in the shallower a spacing depths, this could be artificial due to the location and manipulation due to previous drilling of the immediate area, lower Resistivities at depth but didn’t seem out of place with the 101m and 196m lines Results and Interpretations
California Wash Shows there is a decrease in resistivity on lines 1-4 then a sudden change and increase at line 5 which would be expected as line 5 runs along a horst above the graben which would hold more moisture making the resistivity lower. The Remi data shows also that the velocity models would indicate the graben haslower subsurface layers which could act as a channel keeping in moisture which would increase the conductivity in this area. • Astor Pass shows that there is an anomaly that runs along the 148/160m lines. The data shows an increase in resistivity along this section of Astor Pass, whichwe interpret as being the carbonate build up of the tufa towers in the subsurface.The Remi data also shows the Vs30 velocities decrease along the same lines this indicates the same anomaly along the subsurface roughly along the same 148/160m lines. Leading us to believe that the tufa is acting as the resistor. Conclusions