Download
1 / 95
950 likes | 1.07k Views
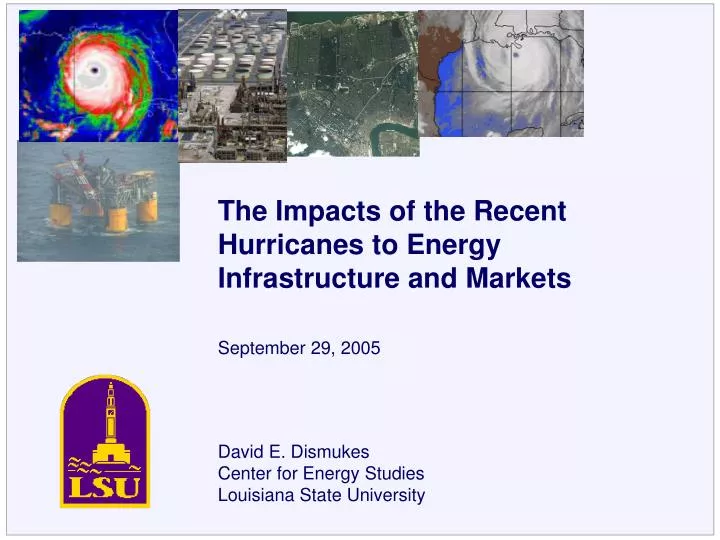
The Impacts of the Recent Hurricanes to Energy Infrastructure and Markets. September 29, 2005. David E. Dismukes Center for Energy Studies Louisiana State University. Center for Energy Studies. Pre-Katrina Energy Markets Already on Edge. Center for Energy Studies.

E N D
The Impacts of the Recent Hurricanes to Energy Infrastructure and Markets September 29, 2005 David E. Dismukes Center for Energy Studies Louisiana State University
Center for Energy Studies Pre-Katrina Energy Markets Already on Edge
Center for Energy Studies Factors Affecting Markets Political and Economic Uncertainty, and Weather Dollar depreciation Weather China’s energy demand growth Iraq post-war insurgency Venezuelan oil strike OPEC decisions Nigerian civil strife
Center for Energy Studies Other: 24.4% Jet Fuel: 9.0% Diesel & Heating Oil: 22.4% Gasoline: 44.2% Crude Oil Stocks Compared to 5-Year Average (Jan-88 through Sep-05) Crude oil stocks are currently 12% above the 5-year average Source: Energy Information Administration
Center for Energy Studies World Oil Demand World oil demand growth currently surging at relatively high rates and continues to be strong through 2006 Projections China’s demand increases 173 percent from 2003 to 2004 Source: Energy Information Administration
Center for Energy Studies World Oil Spare Production Capacity Spare capacity hit its lowest level in 30 years in 2004 and remains fairly low Projections Source: Energy Information Administration
Center for Energy Studies Gasoline Stocks Compared to 5-Year Average (Jan-95 through Sep-05) Gasoline stocks are currently 0.5% below the 5- year average and 0.5% above their 2004 level Source: Energy Information Administration
Center for Energy Studies US Gulf Coast Conventional Gasoline Regular Wholesale Price, Jan-00 through Jul-05 Wholesale gasoline prices were already building over the summer based on high crude prices, tight refining capacity, and strong demand Source: Energy Information Administration
Center for Energy Studies Crude Oil Spot Price - West Texas Intermediate January 2000- July 2005 Crude spot prices explain gasoline prices; these prices have a correlation coefficient of 0.9683 Note: Gasoline price is US Gulf Coast Conventional Gasoline (Regular) Spot Price Source: Energy Information Administration, Department of Energy
Center for Energy Studies Other: 24.4% Jet Fuel: 9.0% Diesel & Heating Oil: 22.4% Gasoline: 44.2% US No. 2 Distillate Prices – Average of Sales to End Users, January 2000- July 2005 Source: Energy Information Administration
Center for Energy Studies Distillate Stocks Compared to 5-Year Average (Jan-88 through Sep-05) Gasoline stocks are currently 5% above the 5- year average and 6% above their 2004 level Source: Energy Information Administration
Center for Energy Studies Natural Gas Spot Price – Henry Hub January 2000- July 2005 Natural gas prices have been increasing steadily since last year’s major hurricane. Big summer time jumps because of high power-related demand. Hurricane Ivan makes landfall September 16, 2004 Source: Federal Reserve Bank of St. Louis
Center for Energy Studies Utilities Meeting New Record Summer Peak Demand
Center for Energy Studies Wholesale Peak Prices into-Entergy, On Peak On average, prices were 48% higher during the 2005 summer months (June, July and August) than they were in 2004 Source: Intercontinental Exchange
Center for Energy Studies Market Clearing Heat Rate into-Entergy, On Peak On average, the market clearing heat rate was 7% higher during the 2005 summer months (June, July and August) than it was in 2004 Source: Intercontinental Exchange
Center for Energy Studies Weekly Natural Gas Injections Relative to Prior Year and 5-Year Average For the past 10 weeks, net injections have been 26% below the 5-year average and 37% below 2004 levels Source: Energy Information Administration, Department of Energy
Center for Energy Studies The WORST Case Scenario: Hurricane Katrina
Center for Energy Studies Hurricane Katrina Storm Track Katrina’s path
Center for Energy Studies Hurricanes Ivan, Dennis and Katrina
Center for Energy Studies Katrina at Louisiana Landfall Katrina’s path Platforms Louisiana state offshore wells
Center for Energy Studies Hurricane Katrina Wind Fields
Center for Energy Studies Immediate Energy Infrastructure Impacts of Katrina
Center for Energy Studies Platforms/Structures Impacted by Katrina
Center for Energy Studies Shut-in Statistics Crude Oil Source: Minerals Management Service
Center for Energy Studies Katrina versus Other Major Hurricanes Shut-in Oil Production Source: Minerals Management Service
Center for Energy Studies Katrina versus Other Major Hurricanes - Shut-in Oil Production as a Percent of Daily GOM Production Source: Minerals Management Service
Center for Energy Studies Refineries Impacted by Katrina Gulf Coast, Port Arthur and Lake Charles Source: Energy Information Administration, Department of Energy
Center for Energy Studies Refineries Shutdown Due to Katrina
Center for Energy Studies Crude and Product Pipelines Impacted by Katrina
Center for Energy Studies Critical Terminals Impacted by Katrina
Center for Energy Studies Critical Electricity Transmission Lines Impacted by Katrina
Center for Energy Studies Critical Terminals and the Power-Pipeline Infrastructure
Center for Energy Studies < 25 25-50 > 50 Gasoline Price Increases August 30, 2005 to September 6, 2005 18 55 33 49 35 58 20 38 35 52 45 56 36 32 54 42 61 49 60 52 25 40 42 36 35 61 42 42 20 50 58 20 61 46 58 45 56 38 45 44 66 Regional Changes in Gasoline Prices (cents per gallon) 24 42 44 24 40 35 Colonial / Plantation Pipeline Systems South Atlantic Mid-Atlantic Northeast Mountain Midwest South West US Source: American Petroleum Institute
Center for Energy Studies Impacts to Refineries outside Gulf Coast Midwest Refiners Supplied by Capline Pipeline Source: Energy Information Administration, Department of Energy
Center for Energy Studies Total Immediate Refinery Impact LA/MS/AL Gulf Coast Refiners (reduced runs and shutdowns) 2,528 thousand bbls/day 15% of US operating capacity Port Arthur/Lake Charles (reduced runs and supply loss) 775 thousand bbls/day 5% of US operating capacity Midwest (reduced runs – supplied by Capline Pipeline) 1,628 thousand bbls/day 10% of US operating capacity Remaining US Operating Capacity 12,075 thousand bbls/day 70% of US operating capacity Total Refinery Impact 4,931 thousand bbls/day 30% of US operating capacity Source: Energy Information Administration, Department of Energy
Center for Energy Studies Shut-in Statistics Natural Gas Source: Minerals Management Service
Center for Energy Studies Katrina versus Other Major Hurricanes Shut-in Natural Gas Production Source: Minerals Management Service
Center for Energy Studies Katrina versus Other Major Hurricanes - Shut-in Gas Production as a Percent of Daily GOM Production Source: Minerals Management Service
Center for Energy Studies Number of Natural Gas Processing Facilities Out Source: Energy Information Administration, Department of Energy
Center for Energy Studies Gas, Product & Crude Pipeline Curtailments Source: Energy Information Administration, Department of Energy
Center for Energy Studies Capline – Colonial - Plantation
Center for Energy Studies Power Outages Number of Customers Source: Energy Information Administration, Department of Energy
Center for Energy Studies Power Outages Generating Stations
Center for Energy Studies Power Outages Generating Stations – Entergy Patterson Source: Entergy
Center for Energy Studies Power Outages Substation Damage Source: Entergy
Center for Energy Studies Petrochemical Facilities Impacted by Katrina
Center for Energy Studies Industrial Facilities Impacted by Katrina
Center for Energy Studies Shell Mars Tension Leg Platform Source: Shell.com
Center for Energy Studies Ocean Warwick Dauphin Island, AL
Center for Energy Studies Venice Port, Supply & Crew Bases