Download
1 / 18
180 likes | 198 Views
This study examines the local and large scale environment of Seyfert and BIRG galaxies, analyzing their relationships with nearby neighbors, morphological types, and activity levels. It explores the clustering tendencies and differences between different types of galaxies in terms of their environments.

E N D
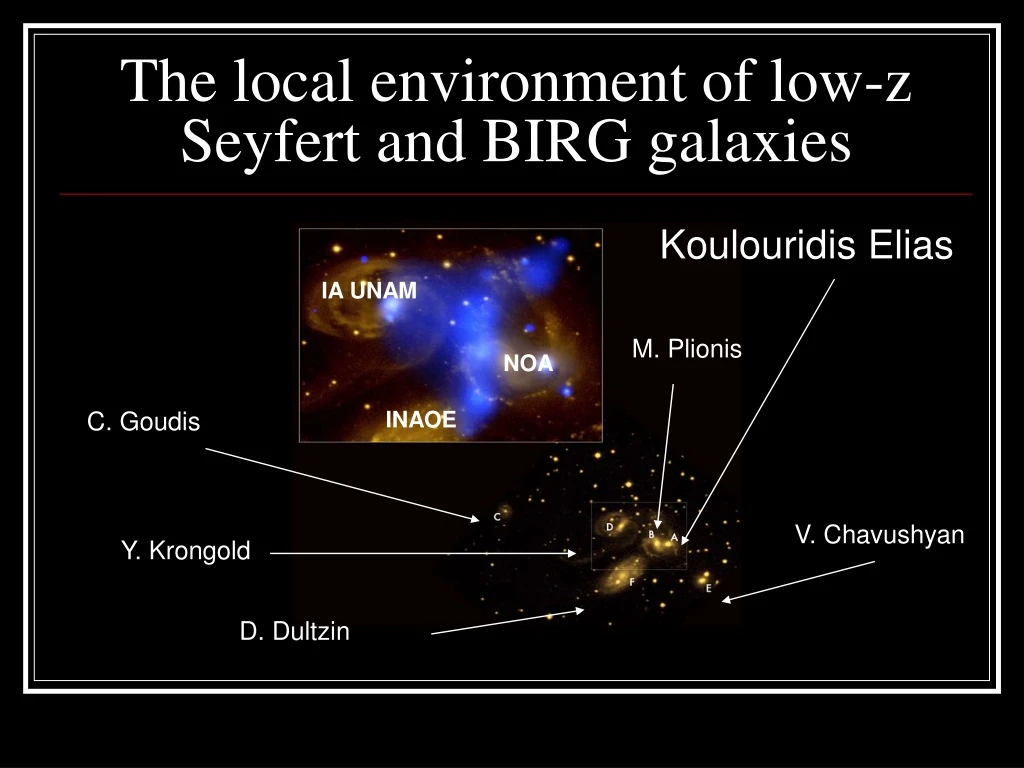
IA UNAM NOA INAOE The local environment of low-z Seyfert and BIRG galaxies Koulouridis Elias M. Plionis C. Goudis V. Chavushyan Y. Krongold D. Dultzin
“Local and Large Scale Environment of Seyfert Galaxies”Complications for the Unification Model.Koulouridis, E.; Plionis, M.; Chavushyan, V.; Dultzin, D.; Krongold, Y.; Goudis, C. “Local and Large Scale Environment of Bright IRAS Galaxies” The AGN/Starburst Connection. Koulouridis, E.; Chavushyan, V.; Plionis, M.; Krongold, Y.; Dultzin, D.
Unification Model(Antonucci 1993) • BLR NLR • ne≈1010cm-3 ne≈102-6cm-3 • M~1-103M⊙ M~1-106-9M⊙ • Size ≈ 1pc Size ≈ 1kpc
Seyfert and Control Samples Dultzin-Hacyan et al., 1999 • Samples of Seyfert were compiled from the catalog of Lipovetsky, Neizvestny and Neizvestnaya • 48 Sy1 (0.007<z<0.036) 47 Sy1-control 56 Sy2 (0.004<z<0.020) 41 Sy2-control • Same morphological type, redshift, and diameter distributions. • Magnitude distribution of Sy1 peaks closer to CfA/SSRS limit.
Neighbours with mB≤15.5 (CfA2 & SSRS) • Red : Sy1 • Blue : Sy2 • Significant higher fraction of Sy2s having a close neighbour within projected distance of 75 hˉ¹ kpc and up to δυ≤600km/s
Our spectroscopic observationsmB≤18.5 • 2.1 m telescope • Guillermo Haro observatory in Cananea, operated by INAOE • Faint Object Spectrograph and Camera (LFOSC) • 4200 – 9000 Å • 15 Å sp. resolution
Large scale environment(radius 1Mpc, δυ≤1000km/s) ∞ • ‹ρ›=∫ Φ(L)dL • Δρ=──── • Significant difference between Sy1-Sy2, but not between Seyferts-controls. • WHY? Lmin(r) ρ - ‹ρ› BECAUSE Sy1s tend to live in earlier type galaxies than Sy2s and earlier type galaxies are more clustered than late type. (Willmer, da Costa and Pellegrini 1998) ‹ρ›
Conclusions • 1. Significantly more Sy2 galaxies have a close neighbour within a projected separation of 75 hˉ¹ kpc and δυ≤600 km/sec • 2. Maybe this is correlated with different types of activity. • 3. In large scales Sy1s tend to live in more dense areas. • 4. Maybe this is due to different morphological types of Seyfert’s hosts.
“Local and Large Scale Environment of Bright IRAS Galaxies” • Samples were compiled from the BIRG Survey by Soifer et al. 1989 and by Sanders et al. 1995. • 87 BIRGs (0.008<z<0.018) • 75 control galaxies.
Neighbours with mB≤15.5 (CfA2 & SSRS) • Significantly higher fraction of BIRGs have a close neighbor in SSRS/CfA in respect with their control sample galaxies . • Significantly higher fraction of BIRGs have a close neighbor in SSRS/CfA in respect with Seyfert galaxies.
Neighbours with mB ≤ 18.5 (our spectroscopy) • Sy1 : 14% 27% • Sy2 : 27% 55% • BIRGs: 42% 54% ≈ 55% 54%
Large Scale Analysis • BIRGs and Sy2s present a similar large scale environment (KS : 0.90) • BIRGs and Sy1s present different large scale environment (KS : 0.03). • Conclusion : BIRGs and Sy2s tend to live in less clustered environment than Sy1s.
Colour Analysis • Starbursts <30kpc < <100kpcxisolated • Sy2s <30kpc < <100kpcx isolated • Normals <30kpc < <100kpcxisolated • Liners <30kpc <<100kpcxisolated
Colour Analysis • Scenario : • Starburst activity is higher when interactions are stronger. • Neighbor moves away starburst activity ceases and Sy2 nuclei appears. • When all interaction is over Sy1 nuclei appears. • (Krongold et al. 2002,2003)
Storchi-Bergmann et al.2001 Sorrentino, Radovich, Rifatto 2006 Sol-Alonso et al. 2007 Gonzalez et al. 2008 Miller et al. 2003 Schmitt 2001 Li & Kauffman 2006 Li et al. 2008 Other studies about the feeding of AGNs & Starbursts and the AGN/Starburst connectionIn favourAgainst
Induced Nuclear Activityinmixed-morphology (E+S) galaxy pairs • J. Jesús González, Yair Krongold, Deborah Dultzin, Hector Hernandez-Toledo, Erendira Huerta, Lorenzo Olguin, Paola Marziani & Irene Cruz-Gonzalez 2008 40% of spirals in isolated (E+S) pairs show nuclear activity (as compared to 20% in random fields including low luminosity LINERs found by Ho et al. 1997) Only ONE out of 39 clear-cut AGN in the sample is type1. 2.6% frequency is too low to be explained by obscuration/orientation effect only
NOW • Detailed spectroscopic analysis of all the neighbors around the subsamples in search of possible activity. (2m telescopes, GHAO & OAN-SPM) • Optical photometry (B & R) of all galaxies. (0.84m & 1.5m telescope, OAN-SPM) • Infrared photometry in search of activity and interactions (2m + CANICA, GHAO) THANK YOU
What follows? • Optical photometry (B & R) of all galaxies. (0.84m & 1.5m telescope, OAN-SPM) • Infrared photometry in search of activity and interactions (2m + CANICA, GHAO) THANK YOU