Download
1 / 54
540 likes | 721 Views
Optimizing Clean and Efficient Energy Technologies through Tax and Fiscal Policy. INTERNATIONAL FORUM ON TAX AND FISCAL POLICIES TO PROMOTE CLEAN ENERGY DEVELOPMENT The Great Hall of the People, Beijing, P.R. China November 16-17, 2005. Advantages and limitations of free-market economies.

E N D
Optimizing Clean and Efficient Energy Technologies through Taxand Fiscal Policy INTERNATIONAL FORUM ON TAX AND FISCAL POLICIES TO PROMOTE CLEAN ENERGY DEVELOPMENT The Great Hall of the People, Beijing, P.R. China November 16-17, 2005
Advantages and limitationsof free-market economies • Free-markets provide powerful incentives for innovation (One works hardest for self-gain) • They are more nimble than regulated economies Question: How many free-market economists does it take to change a light bulb? Answer: None. If it needed changing, free-market forces would have taken care of it.
The downsides of free-market economies • Free markets do not always account for “externalities” (e.g. pollution, climate change) • Public goods need to be supported by taxation (e.g. national security, roads and bridges) • “Survival of the fittest” does not always mean “survival of the best”. (e.g. unethical or predatory business practices). Regulation and transparent legal enforcement is needed • Free markets do not respond well to long term problems or international/global issues.(e.g. international fishing, international pollution) Regulatory treaties? International Taxes?
The externalities related to energy • Energy dependence costs • Environmental costs Polices that modify free-markets. • Global incentives (carrots), dis-incentives (sticks), commands (regulation) • Stimulating long term investments in research and development to commercialization
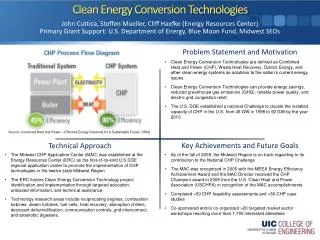
China oil consumption and production 1980 -2005 US became a new importer of oil in 1970
Current price! Uncertain cost of energy
Current price Factors affecting crude oil prices
World Energy Consumption from 1970-2020 is projected to triple: uncertain access to energy
“Hubbert Curves” with different assumptions of rate of decline using GSGS and DOE best estimates of total discovered and undiscovered global reserves Source: World Energy Outlook, 2001 by the International Energy Agency, a body of the Organization for Economic Co-operation and Development (OECD)
The externalities related to energy • Energy dependence costs • Health and environmental costs Polices that modify free-markets. • Global incentives (carrots), dis-incentives (sticks), commands (regulation) • Stimulating long term investments in research and development to commercialization
O3 (ozone), Carbon monoxide (CO),Sulfur dioxide (SO2), Nitrous oxides (NOx), Particulate matter, … • Respiratory illnesses, cancers, … • Premature ageing of buildings, bridges, and other infrastructure • Damage to agricultural, forests, lakes, wildlife
Tiananmen Square, Beijing. Greg Baker/Associated Press
Smog over Urumchi, Xinjiang Uighur Autonomous Region. A study by a Chinese research institute found that 400,000 people die prematurely every year in China from diseases linked to air pollution. Song Yang/Imaginechina
A cement factory in Qianwei, Sichuan, China. Liu Jin/Agence France-Presse - Getty Images
Average global temperature rise since 1860 • 19 of the 20 warmest years since 1860 have all occurred since 1980. • 1998 was the warmest year in the instrumental record and probably the warmest in 1,000 years.
1750,the beginning of the industrial revolution Concentration of Greenhouse gases
Climate change due to natural causes and human generated greenhouse gases Can we predict the past? Climate change due to natural causes (solar variations, volcanoes, etc.)
2 x CO2 4 x CO2 Computer simulations by the Princeton Geophysical Fluid Dynamics Lab for CO2 increases above pre-industrial revolution levels: 2x CO2: 5 – 8° F 4x CO2 : 15-25° F Pre-industrial: ~275 ppmToday: ~380 ppm
Summer soil moisture in N America under doubled & quadrupled CO2 (from the Princeton GFDL model) Mid-continent soil-moisture reductions reach 50-60% in the 4xCO2 world.
CO2 Concentration, Temperature, and Sea Level Continue to Rise Long after Emissions are Reduced Sea-level rise due to ice melting: several millennia Sea-level rise due to thermal expansion: centuries to millennia CO2 emissions peak 0 to 100 years Temperature stabilization: a few centuries CO2 stabilization: 100 to 300 years CO2 emissions Today 1,000 years 100 years
The externalities related to energy • Energy dependence costs • Health and environmental costs Polices that modify free-markets. • Incentives (tax credits), dis-incentives (taxes or caps), commands (regulation) • Stimulating long term investments in research and development to commercialization
A dual strategy is needed: • Conservation: maximize energy efficiency and minimize energy use, while insuring economic prosperity • Provide incentives to develop new sources of clean energy
US China
Afternoon rush hour traffic on Beijing's Second Ring Road. China's pollution levels could quadruple within the next 15 years, if the growth in energy consumption and automobile use is not controlled. Associated Press photo
Higher cost of gas is correlated with fuel efficiency of automobiles Control of automobile usage and efficiency requires both control by regulations and cost dis-incentives (tax on gas and large car purchases)
Traffic congestion in cities can not be solved by more roads alone. Note the relative congestion of light rail, buses and cars
Bus rapid transit Subway Three options to mass transit with large variations in cost. Light rail
Regulation stimulates technology: Refrigerator efficiency standards and performance. The expectation of efficiency standards also stimulated industry innovation
The externalities related to energy • Energy dependence costs • Health and environmental costs Polices that modify free-markets. • Incentives (tax credits), dis-incentives (taxes or caps), commands (regulation) • Stimulating long term investments in research and development to commercialization
California utility companies now urge and help their customers conserve electricity Profit to utility companies was decoupled from the amount of energy sold. • Initially, US electric utility industry were a regulated monopolies where rate-of-return on investments was set by regulatory agencies. Utility companies promoted the use of energy to maximize profits. • Environmental regulations and disallowances of investments by state regulators of nuclear power generation created financial stresses in utility companies. • “Least-cost Planning” is in place. Energy conservation decreases the need to build more power generating plants. Fair return of investment is guaranteed.
My concerns about the current California utility system • Changes in the cost of fuel are passed through to the consumer(Compromises incentives to the utilities companies to be more energy efficient) • There are no incentives for utility companies to invest in long term research • The electricity generation and distribution industry is becoming in danger of becoming more de-integrated. • Micro-economics forces to maximize profits might encourage companies to stimulate higher energy usage by selling more energy intensive “services”.
International Energy Agency (IEA) Carbon Emission forecast Between 2003-2030: New Coal Plants = 1.4 TW New Natural Gas Plants = 1.9 TW Carbon emission in the next 30 years will add 3x more CO2 emission than the previous 250 years! Energy from tar sands, shale oil, methane hydrates … will be as bad as coal for greenhouse gas emissions.
Limiting CO2 is the biggest economic problem • A carbon tax or carbon cap is needed • Clear signals should be given that a tax or cap will occur so that companies can plan. • Private (industrial) and public investments in renewable sources must be encouraged. • Progressive changes in the carbon tax/cap should be initiated to stimulate research and development of alternative solutions.
Carbon Sequestration needs more research • Long term storage and environmental safety are yet to be proven. • Cost is also an issue! Using present technology, sequestration costs are $100 - 300/ton of avoided carbon emissions. • The US Department of Energy has a target to reduce the cost of carbon sequestration to $10 or less per net ton of avoided emissions by 2015.
CO2 emission sources and sedimentary basins with geological storage potential Is large scale sequestration possible in China?
2. Nuclear Fission Potential Sources of Carbon Neutral Energy 1. Nuclear Fusion Magnetic plasma confinement or inertial fusion. At least 40 - 50 years in the future Waste and Nuclear Proliferation 3 TW = One new GW reactor every week for the next 50 years)
Tax incentives and rebates were essential to stimulate continued development of power generation from wind
Cost of electricity generation(1990 dollars/kilowatt hour) Photovoltaics Windmills Gas turbines
Photosynthesis:Nature has found a way to convert sunlight, CO2, water and nutrients into chemical energy
Cellulose 40-60% Percent Dry Weight Hemicellulose 20-40% Lignin 10-25% Improved conversion of cellulose into chemical fuel Self-fertilizing,drought and pest resistant The majority of a plant is structural material Sunlight CO2,H20, Nutrients Chemical energy Biomass
Identify the biosynthesis pathways in A. annua Synthetic Biology:Production of artemisinin in bacteria Jay Keasling Can synthetic organisms be engineered to produce ethanol, methanol or methane from cellulose or directly from sunlight?
and International National Concerns which is intimately tied to energy security 1) National security 2) Economic prosperity 3) The environment Sustainable, CO2 neutral energy
The US phone system (AT&T) was a vertically integrated monopoly. Phone service was reliable and of moderate cost. • Others wanted access to this market, claiming that competition would drive down prices. • 20 years later our total phone bills are much higher due to competition to promote higher usage (text messaging, photograph transmission over phone data channels, … Telecom companies are reluctant to invest in long-term research
Temperature over the last 420,000 years Source: Working Group I of the Intergovernmental Panel on Climate Change We are here