Download
1 / 7
80 likes | 244 Views
A Taste of Chemistry. Perception of Taste. INTRODUCTION.

E N D
A Taste of Chemistry Perception of Taste
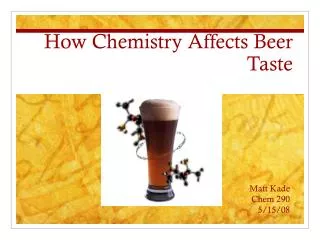
INTRODUCTION • Flavor and taste are both perceived based on genetic and environmental factors, leading to individual differences. Dr. Albert F. Blakeslee conducted a taste and smell demonstration and and published his paper in Science in 1935. He discovered, people’s perceptions varied greatly and were affected by even cooking methods. We will simplify his demonstration and compare our results.
ICEBREAKER • What is your favorite food? • What is your least favorite food? • How often do you eat home cooked meals? • Do you consider yourself a picky eater? • Do you consider yourself an adventurous eater? Are you a more adventurous eater than your friends and family?
MATERIALS Collect the following a cup of water a paper towel a sampling tray of food & beverage items *(DO NOT SAMPLE ANY FOODSTUFS UNTIL INSTRUCTED BY YOUR TEACHER)
SAMPLES A Leaf of Cilantro (Arugula) 1 Olive 1 Grape Tomato 1 Broccoli “Tree” 1 Celery Chunk ( ½ inch) 1 Sour Candy Ball 1 Piece of Dark Chocolate 1 Tonic Water Sample
PROCEDURE • Eat each food sample in the order it is given. • After eating each sample, complete the survey item • Drink a sip of water in between each sample to rinse the last taste • Continue until you have sampled every food item • Graph your results and compare them to that of your classmates
MEAL SURVEY Use the scale below ranging from 0 to 100 with zero “0” representing a strong dislike and one hundred “100” representing a strong like.