Microarray Cancer Classification: Novel Approaches in Class Prediction and Discovery
This lecture by Prof. Chen Yu Zong focuses on the significance of microarray technology in cancer classification, highlighting the limitations of traditional methods. It introduces two innovative approaches for classifying new tumors and discovering unknown cancer subclasses without relying on previous biological information. Emphasizing the importance of accurate cancer categorization for treatment, the talk covers methods such as neighborhood analysis for identifying informative genes. The effectiveness of these methodologies is showcased through data validation from leukemia samples, underscoring their potential in improving disease outcome prediction.


Microarray Cancer Classification: Novel Approaches in Class Prediction and Discovery
E N D
Presentation Transcript
CZ5225: Modeling and Simulation in BiologyLecture 6, Microarray Cancer Classification Prof. Chen Yu ZongTel: 6874-6877Email: csccyz@nus.edu.sghttp://xin.cz3.nus.edu.sgRoom 07-24, level 7, SOC1, National University of Singapore
Why Microarray? • Although there has been some improvements over the past 30 years still there exists no general way for: • Identifying new cancer classes • Assigning tumors to known classes • In this paper they are introducing two general ways for • Class prediction of a new tumor • Class discovery of new unknown subclasses • Without using the previous biological information
Why Microarray? • Why do we need to classify cancers? • The general way of treating cancer is to: • Categorize the cancers in different classes • Use specific treatment for each of the classes • Traditional way • Morphological appearance.
Why Microarray? • Why traditional ways are not enough ? • There exists some tumors in the same class with completely different clinical courses • May be more accurate classification is needed • Assigning new tumors to known cancer classes is not easy • e.g. assigning an acute leukemia tumor to one of the • AML • ALL
Cancer Classification • Class discovery • Identifying new cancer classes • Class Prediction • Assigning tumors to known classes
Cancer Genes and Pathways • 15 cancer-related pathways, 291 cancer genes, 34 angiogenesis genes, 12 tumor immune tolerance genes Nature Medicine 10, 789-799 (2004); Nature Reviews Cancer 4, 177-183 (2004), 6, 613-625 (2006); Critical Reviews in Oncology/Hematology 59, 40-50 (2006) http://bidd.nus.edu.sg/group/trmp/trmp.asp
Most discriminative genes Patient i: Disease outcome prediction with microarray Patient SVM Important genes Normal person j: Normal Patient i: Signatures Predictor-genes Patient SVM Normal person j: Better predictive power Clues to disease genes, drug targets Normal
Patient i: Patient SVM Normal person j: Normal • Expected features of signatures: • Composition: • Certain percentages of cancer genes, genes in cancer pathways, and angiogenesis genes • Stability: • Similar set of predictor-genes in different patient compositions measures under the same or similar conditions Disease outcome prediction with microarray How many genes should be in a signature?
Class Prediction • How could one use an initial collection of samples belonging to known classes to create a class Predictor? • Gathering samples • Hybridizing RNA’s to the microarray • Obtaining quantitative expression level of each gene • Identification of Informative Genes via Neighborhood Analysis • Weighted votes
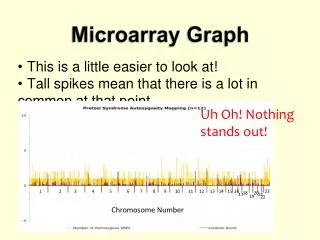
Neighborhood Analysis • We want to identify the genes whose expression pattern were strongly correlated with the class distinction to be predicted and ignoring other genes • Each gene is presented by an expression vector consisting of its expression level in each sample. • Counting no. of genes having various levels of correlation with ideal gene c. • Comparing with the correlation of randomly permuted c with it • The results show an unusually high density of correlated genes!
Idealized expression pattern Neighborhood analysis
Class Predictor • The General approach • Choosing a set of informative genes based on their correlation with the class distinction • Each informative gene casts a weighted vote for one of the classes • Summing up the votes to determine the winning class and the prediction strength
Computing Votes • Each gene Gi votes for AML or ALL depending on : • If the expression level of the gene in the new tumor is nearer to the mean of Gi in AML or ALL • The value of the vote is : • WiVi where: • Wi reflects how well Gi is correlated with the class distinction • Vi = | xi – (AML mean + ALL mean) / 2 | • The prediction strength reflects: • Margin of victory • (Vwin – Vloose) / (Vwin + Vloose)
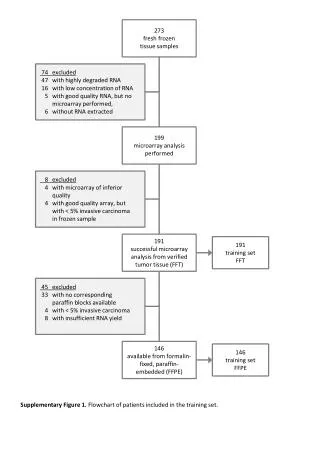
Evaluation • DATA • Initial Sample • 38 Bone Marrow Samples (27 ALL, 11 AML) obtained at the time of diagnosis. • Independent Sample • 34 leukemia consisted of 24 bone marrow and 10 peripheral blood samples (20 ALL and 14 AML). • Validation of Gene Voting • Initial Samples • 36 of the 38 samples as either AML or ALL and two as uncertain. All 36 samples agrees with clinical diagnosis. • Independent Samples • 29 of 34 samples are strongly predicted with 100% accuracy.
An early kind of analysis: unsupervised learning learning disease sub-types p53 Rb
Sub-type learning: seeking ‘natural’ groupings & hoping that they will be useful… p53 Rb
E.g., for treatment Respond to treatment Tx1 p53 Do not Respond to treatment Tx1 Rb
The ‘one-solution fits all’ trap Do not Respond to treatment Tx2 p53 Rb Respond to treatment Tx2
Predictive Biomarkers & Supervised Learning Predictive Biomarkers
A more modern view 2: Unsupervised learning as structure learning
Causative biomarkers & (structural) unsupervised learning Causative Biomarkers
If 2D looks good, what happens in 3D? • 10,000-50,000 (regular gene expression microarrays, aCGH, and early SNP arrays) • 500,000 (tiled microarrays, SNP arrays) • 10,000-300,000 (regular MS proteomics) • >10, 000, 000 (LC-MS proteomics) This is the ‘curse of dimensionality problem’
Problems associated with high-dimensionality (especially with small samples) • Some methods do not run at all (classical regression) • Some methods give bad results • Very slow analysis • Very expensive/cumbersome clinical application
P O A E C D B K T H I J Q L M N Solution 2: feature selection
Another (very real and unpleasant) problem Over-fitting • Over-fitting ( a model to your data)= building a model than is good in original data but fails to generalize well to fresh data
Over-fitting is directly related to the complexity of decision surface (relative to the complexity of modeling task)
Over-fitting is also caused by multiple validations & small samples
Over-fitting is also caused by multiple validations & small samples
A method to produce realistic performance estimates: nested n-fold cross-validation
Datasets • Bhattacharjee2 - Lung cancer vs normals [GE/DX] • Bhattacharjee2_I - Lung cancer vs normals on common genes between Bhattacharjee2 and Beer [GE/DX] • Bhattacharjee3 - Adenocarcinoma vs Squamous [GE/DX] • Bhattacharjee3_I - Adenocarcinoma vs Squamous on common genes between Bhattacharjee3 and Su [GE/DX] • Savage - Mediastinal large B-cell lymphoma vs diffuse large B-cell lymphoma [GE/DX] • Rosenwald4 - 3-year lymphoma survival [GE/CO] • Rosenwald5 - 5-year lymphoma survival [GE/CO] • Rosenwald6 - 7-year lymphoma survival [GE/CO] • Adam - Prostate cancer vs benign prostate hyperplasia and normals [MS/DX] • Yeoh - Classification between 6 types of leukemia [GE/DX-MC] • Conrads - Ovarian cancer vs normals [MS/DX] • Beer_I - Lung cancer vs normals (common genes with Bhattacharjee2) [GE/DX] • Su_I - Adenocarcinoma vs squamous (common genes with Bhattacharjee3) [GE/DX • Banez - Prostate cancer vs normals [MS/DX]
Methods: Gene Selection Algorithms • ALL - No feature selection • LARS - LARS • HITON_PC - • HITON_PC_W -HITON_PC+ wrapping phase • HITON_MB - • HITON_MB_W -HITON_MB + wrapping phase • GA_KNN - GA/KNN • RFE - RFE with validation of feature subset with optimized polynomial kernel • RFE_Guyon - RFE with validation of feature subset with linear kernel (as in Guyon) • RFE_POLY - RFE (with polynomial kernel) with validation of feature subset with polynomial optimized kernel • RFE_POLY_Guyon - RFE (with polynomial kernel) with validation of feature subset with linear kernel (as in Guyon) • SIMCA - SIMCA (Soft Independent Modeling of Class Analogy): PCA based method • SIMCA_SVM - SIMCA (Soft Independent Modeling of Class Analogy): PCA based method with validation of feature subset by SVM • WFCCM_CCR - Weighted Flexible Compound Covariate Method (WFCCM) applied as in Clinical Cancer Research paper by Yamagata (analysis of microarray data) • WFCCM_Lancet - Weighted Flexible Compound Covariate Method (WFCCM) applied as in Lancet paper by Yanagisawa (analysis of mass-spectrometry data) • UAF_KW - Univariate with Kruskal-Walis statistic • UAF_BW - Univariate with ratio of genes between groups to within group sum of squares • UAF_S2N - Univariate with signal-to-noise statistic
Classification Performance (average over all tasks/datasets)
How well dimensionality reduction and feature selection work in practice?
Number of Selected Features (average over all tasks/datasets)
Number of Selected Features (average over all tasks/datasets)