
engineering
E N D
Presentation Transcript
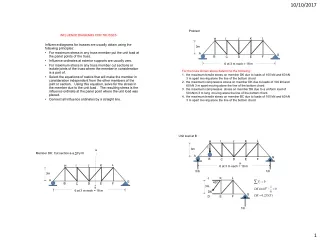
10/10/2017 Problem INFLUENCE DIAGRAMS FOR TRUSSES L J K I H Influence diagrams for trusses are usually obtain using the following principles: • For maximum stress in any truss member put the unit load at the panel points of the truss. • Influence ordinates at exterior supports are usually zero. • For maximum stress in any truss member cut sections or isolate joints of the truss where the member in consideration is a part of. • Select the equations of statics that will make the member in consideration independent from the other members of the joint or section. Using this equation, solve for the stress in the member due to the unit load . The resulting stress is the influence ordinate at the panel point where the unit load was placed. • Connect all influence ordinates by a straight line. 3m A G B D E F C 6 at 3 m each = 18 m For the truss shown above determine the following: 1. the maximum tensile stress on member DK due to loads of 100 kN and 60 kN 3 m apart moving alone the line of the bottom chord. 2. the maximum compressive stress on member DK due to loads of 100 kN and 60 kN 3 m apart moving alone the line of the bottom chord. 3. the maximum compressive stress on member DK due to a uniform load of 50 kN/m 3 m long moving alone the line of the bottom chord. 4. the maximum tensile stress on member BC due to loads of 100 kN and 60 kN 3 m apart moving alone the line of the bottom chord. Unit load at B L J K I H 1 3m a Member DK: Cut section a-a,∑Fy=0 A G B D E F C a L J K I H 6 at 3 m each = 18 m 5/6 1/6 3m L J K A Fy 0 G 450 B D E F C 3m 1 a 0 DK sin 45 0 6 at 3 m each = 18 m 6 DK G DK . 0 235 ( T ) D E F 1/6 1
10/10/2017 Unit load at D Unit load at C L J K I H L J K I H 1 3m 1 3m A G A G B D E F C B D E F C a a 6 at 3 m each = 18 m 6 at 3 m each = 18 m 1/2 1/2 2/3 1/3 L L J K J K Fy 0 450 450 Fy 0 3m 3m 1 1 0 DK sin 45 0 DK 0 DK sin 45 0 2 DK 3 G G DK . 0 705 ( T ) D E F D E F DK . 0 47 ( T ) 1/2 1/3 Unit load at E Unit load at F L L J K J K I I H H 1 1 3m 3m A A G G B B D E F D E F C C a a 6 at 3 m each = 18 m 6 at 3 m each = 18 m 1/3 2/3 1/6 5/6 L L J K J K I I H H DK DK 3m 3m Fy 0 Fy 0 450 450 1 1 A A 0 0 DK sin 45 0 DK sin 45 0 B B D D C C 3 6 C DK . 0 47 ( C ) DK . 0 235 ( ) 1/3 1/6 2
10/10/2017 J K I H 1 3m 0.705 A G 0.47 100 60 B D E F C 0.235 5/6 6 at 3 m each = 18 m 0.705 100 0.235 0.47 2. Maximum Compressive stress in DK 0.47 60 0.235 DK =100(0.47)+60(0.235) =61.1 kN 0.235 0.47 1. Maximum TENSILE stress in DK DK =100(0.705)+60(0.47) =98.7 kN J K I H Member BC : Cut section a-a: ∑MH=0 1 3m L J K I H A G B D E F C 3m 5/6 6 at 3 m each = 18 m A G B D E F C 0.705 3m 0.47 6 at 3 m each = 18 m 0.235 50kN/m 3) Maximum Compressive stress in DK 0.235 0.47 . 0 ( 1 47 . 0 235 ) DK ) 3 ( 50 52 89 . kN 2 3
10/10/2017 Unit load at C Unit load at B J K I H J K I H 1 3m 1 3m A G A B G D E F C B D E F C 4/6 6 at 3 m each = 18 m 5/6 6 at 3 m each = 18 m 0 I M H H 0 I M H 2T 4 H BC 3m ( ) BC ) 3 ( ) 3 ( 6 0 5T 5 3 BC 1 3m ( ) BC ) 3 ( ) 3 ( 6 0 A 6 B C A B C 4/6 3m 5/6 3m Unit load at E Unit load at D J K I H J K I H 1 3m 1 3m A A G G B D E F C B D E F C 2/6 6 at 3 m each = 18 m 1/2 6 at 3 m each = 18 m 0 0 I I M H M H H H 1T 1 1T 2 BC 3m BC 3m ( ) BC ) 3 ( ) 3 ( 2 0 ( ) BC ) 3 ( ) 3 ( 6 0 2 3 A A B B C C 1/2 2/6 3m 3m 4
10/10/2017 Influence diagram for stress in BC Unit load at F J K I H J K I H 1 3m 1 3m A G A B G D E F C B D E F C 5/6 6 at 3 m each = 18 m 1/6 6 at 3 m each = 18 m 5/6 2/3 60 0 I M H 1/2 H 100 1/3 1T 1 BC 3m 1/6 ( ) BC ) 3 ( ) 3 ( 6 0 6 A B C Maximum tensile stress in BC 1/6 3m BC =100(5/6)+60(2/3) =123.33 kN Problem: For the truss shown above determine the maximum stress in BH due to loads of 100 kN and 60 kN spaced at 2 m on centers. BH = 1 Unit load at A,C,D,E.F & G produces zero Stress in BH L J K I H B 6m A G 1 B D E F C L J K I H 6 at 8 m each = 48 m 6m Solution: Isolate Joint B, ∑Fy=0 Unit load at B A G B D E F C L J K I H 1 Influence diagram for stress in BH 6 1 100 60 6m 1 y 3 y y 4 8 A G B D E F C Max stress in BH BH =100(1)+60(3/4) = 145 kN (T) 6 at 8 m each = 48 m 5
10/10/2017 Problem For the deck truss shown in figure, determine the maximum stress in members BC, HI and CI due to the moving loads shown. Solution: BC: Cut section a –a ,∑MH=0 5 at 6 m each = 30 m A B C D E F 5 at 6 m each = 30 m Note; All triangles are equilateral a A B C D E F G H I J K 120 kN 90 kN G H I J K a More than 30 m long 2m 15 kN/m Unit load at B 1 Unit load at C 1 a a A C D E F B A B C D E F 3/5 2/5 1/5 G H I J K G H I J K 9 m BC C D E F A B BC 3tan600=5.2 3tan600=5.2 3/5 1/5 G H H I J K 21 1 3 BC BC 0 . 0 81 ( C ) 0 . 1 04 ( C ) M BC ) 2 . 5 ( ( 21 ) 0 M BC ) 2 . 5 ( ) 9 ( 5 0 H H 5 6
10/10/2017 1 Unit load at E Unit load at D 1 a a A C D E F B A C D E F B 1/5 2/5 4/5 G H I J K 3/5 G H I J K 9 m 9 m A B A B BC BC 3tan600=5.2 3tan600=5.2 1/5 2/5 G H G H 1 2 BC 0 . 0 345 ( C ) M BC ) 2 . 5 ( ) 9 ( 5 0 BC 0 . 0 69 ( C ) M BC ) 2 . 5 ( ) 9 ( 5 0 H H 5 at 6 m each = 30 m Position of load to produce maximum stress in BC A B C D E F 6m 6m 18 m G H I J K 1.04 15 kN/m 90 120 1.04 0.345 0.97 0.345 0.69 0.69 0.81 0.81 1.04 Influence diagram for stress in BC maximum stress in BC BC 6 4 Py wA y . 1 04 z . 0 23 4 y=0.16+0.81=0.97 z . 0 16 16 18 6 0.81 . 1 1 . 0 [ 81 04 ] 1 y y . 0 92 BC 90 . 0 ( 97 ) 120 . 1 ( 04 ) . 0 81 ) 6 ( 15 ( 6 15 ) . 1 ( 2 04 18 ) 15 ( ) 2 2 z 0.23 BC 472 2 . kN Use y =0.97 7
10/10/2017 Unit load at B 1 a A B C D E F Solution HI: Cut section a –a ,∑MC=0 . 5 at 6 m each = 30 m 1/5 G H I J K a A B C D E F C D E F G H I J K a 3tan600=5.2 HI 1/5 I J K 18 1 HI 0 . 0 69 ( T ) M ) 2 . 5 ( HI 18 ( ) 0 C 5 1 Unit load at C 1 Unit load at D a a A C D E F B A C D E F B 2/5 3/5 3/5 G H I J K 2/5 G H I J K 12 m 12 m A B C A B C 3tan600=5.2 3tan600=5.2 HI 2/5 HI 3/5 G H G H 2 3 HI 0 . 0 92 ( T ) M ) 2 . 5 ( HI 12 ( ) 0 HI 0 . 1 38 ( T ) M ) 2 . 5 ( HI 12 ( ) 0 H 5 H 5 8
10/10/2017 1 Unit load at E a 5 at 6 m each = 30 m D A C E F E B A B C D E F 1/5 4/5 G H I J K G H I J K 12 m 1.38 A B C 0.92 0.69 0.46 3tan600=5.2 HI 1/5 G H Influence diagram for stress in HI 1 HI 0 . 0 46 ( T ) M ) 2 . 5 ( HI 12 ( ) 0 H 5 Position of load to produce maximum stress in HI 1.38 120 90 0.92 Solution CI: Cut section a –a ,∑Fy=0 . 0.69 0.46 15 kN/m 5 at 6 m each = 30 m a A B C D E F y . 1 38 . 1 y 23 16 18 maximum stress in HI HI G H I J K a Py wA 1 HI 90 . 1 ( 23 ) 120 . 1 ( 38 ) . 1 2 38 30 ( 15 ) 586 8 . kN ( T ) 9
10/10/2017 Unit load at B Unit load at C 5 at 6 m each = 30 m 1 1 5 at 6 m each = 30 m a a A B C D E F A B C D E F 1/5 2/5 G H I J K a G H I J K a a a 0 yF 0 D E F yF D E F CI CI 1 2 0 CI sin 60 0 0 CI sin 60 0 5 5 600 1/5 600 2/5 CI . 0 231 ( C ) CI . 0 462 ( C ) I J K a I J K a Unit load at E Unit load at D 5 at 6 m each = 30 m 5 at 6 m each = 30 m 1 1 a a A B C D E F A B C D E F 1/5 2/5 G H I J K a G H I J K a 0 A yF 0 B C A yF B C 600 600 1 2 0 CI sin 60 0 0 CI sin 60 0 CI 5 CI 1/5 5 2/5 G H I CI . 0 231 ( T ) CI . 0 462 ( T ) G H I 10
10/10/2017 position of loading to produce maximum stress in CI 5 at 6 m each = 30 m A B C D E F 3m G H I J K 0.462 120 90 G H I J K 0.462 0.231 y 0.231 15 kN/m 2m 10m 0.231 y . 0 462 10 y . 0 385 0.231 0.462 12 maximum stress in CI CI 0.462 Py wA Influence diagram for stress in CI 1 CI 90 . 0 ( 385 ) 120 . 0 ( 462 ) . 0 462 15 ( 15 ) 142 07 . kN ( TorC ) 2 Plate: Influence Diagrams 1. An overhanging beam 12 m long between supports extends 3 m beyond the right support. It is subject to the passage of a concentrated load of 15+2N kN and 18+ N kN spaced 2 m apart and a uniformly distributed load of 15N kN/m whose length is more than 15 m. Determine the following a). the maximum reaction at the left support b) the maximum reaction at the right support c) the maximum positive shear 3 m from the left support d) the maximum negative shear 6 m from the left support e) the maximum positive moment 6 m from the left support 2. A cantilever beam 12 m long is subject to the passage of two concentrated loads of 6+N kN and 9+2N kN spaced 3 m apart . If the fixed support of the beam is at the rightmost end of the beam, determine the following: a) Maximum reaction at the support b) Maximum shear 6 m from the left end c) Maximum moment 9 m from the right end Influence diagrams for trusses: For the truss shown in figure, determine the maximum stress in members BC, HI and DI due to the moving loads shown. B C D E F 6m A G H I J K 5 at 8 m each = 40 m 100+2N kN 90 +N kN More than 40 m long 2m 15+3N kN/m 11