Download
1 / 1
10 likes | 142 Views
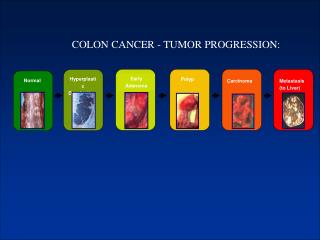
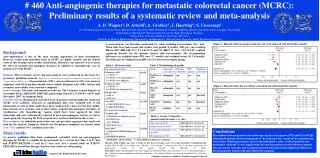
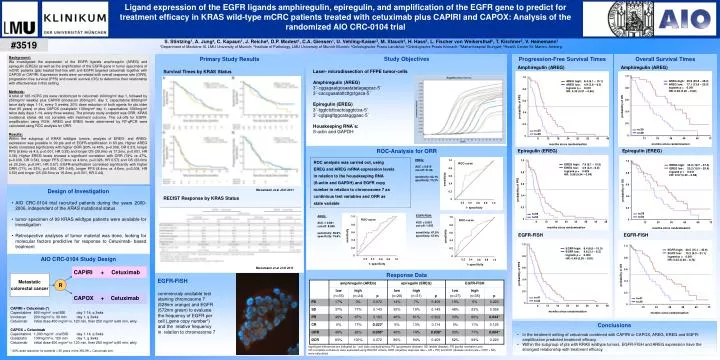
Ligand expression of the EGFR ligands amphiregulin, epiregulin, and amplification of the EGFR gene to predict for treatment efficacy in KRAS wild-type mCRC patients treated with cetuximab plus CAPIRI and CAPOX: Analysis of the randomized AIO CRC-0104 trial. 1.0. 1.0. 1.0. EGFR-FISH:

E N D
Ligand expression of the EGFR ligands amphiregulin, epiregulin, and amplification of the EGFR gene to predict for treatment efficacy in KRAS wild-type mCRC patients treated with cetuximab plus CAPIRI and CAPOX: Analysis of the randomized AIO CRC-0104 trial 1.0 1.0 1.0 EGFR-FISH: AUC = 0.651 cut-off: 1.055 sensitivity: 67.9% specificity: 57.8% EREG high: 7.9 (6.1 – 10.0) EREG low: 4.9 (3.0 – 6.8) logrank p = 0.026 HR: 0.58 (0.34 – 0.94) AREG high: 8.4 (6.1 – 13.1) AREG low: 4.9 (3.8 – 6.0) logrank p < 0.001 HR: 0.35 (0.21 – 0.60) EGFR-high: 8.4 (6.8 – 10.0) EGFR low: 4.6 (3.1 – 6.2) logrank p = 0.004 HR: 0.49 (0.30 – 0.81) 1.0 ROC-curve 0.8 0.8 0.8 0.8 0.6 0.6 0.6 0.6 sensitivity 0.4 probability of PFS probability of PFS probability of PFS 0.4 0.4 0.4 0.2 0 0.2 0.2 0.2 0.4 0.2 0.6 0.8 1.0 1- specificity n=41 n=34 n=39 n=30 n=30 n=39 0 0 0 30 30 30 36 36 36 42 42 42 48 48 48 18 18 18 24 24 24 6 6 6 12 12 12 months since randomisation months since randomisation months since randomisation 1.0 1.0 1.0 EREG-high: 33.0 (18.7 – 47.3) EREG low: 20.2 (15.0 – 25.4) logrank p = 0.041 HR: 0.57 (0.33 – 0.98) AREG-high: 39.9 (30.8 – 49.0) AREG low: 17.1 (13.8 – 20.5) logrank p < 0.001 HR: 0.36 (0.20 – 0.63) EGFR-high: 30.5 (15.1 – 45.9) EGFR low: 15.2 (9.3 – 21.1) logrank p = 0.001 HR: 0.44 (0.26 – 0.74) 0.8 0.8 0.8 0.6 0.6 0.6 probability of OS probability of OS probability of OS 0.4 0.4 0.4 0.2 0.2 0.2 EREG: AUC = 0.615 cut-off: 31.66 sensitivity: 62.1% specificity: 73.2% 1.0 ROC-curve n=39 n=30 n=30 n=39 n=41 n=34 0.8 0 0 0 48 48 48 60 60 60 72 72 72 24 24 24 36 36 36 12 12 12 0.6 months since randomisation months since randomisation months since randomisation sensitivity 0.4 0.2 0 0.4 0.2 0.6 0.8 1.0 1- specificity AREG: AUC = 0.661 cut-off: 8.855 sensitivity: 56.9% specificity: 75.6% 1.0 ROC-curve 0.8 0.6 sensitivity 0.4 0.2 0 0.4 0.2 0.6 0.8 1.0 1- specificity S. Stintzing1, A. Jung², C. Kapaun1, J. Reiche², D.P. Modest1, C.A. Giessen1, U. Vehling-Kaiser3, M. Stauch4, H. Hass5, L. Fischer von Weikersthal6, T. Kirchner2, V. Heinemann1 1Department of Medicine III, LMU University of Munich; ²Institute of Pathology, LMU University of Munich Munich; ³Onkologische Praxis Landshut; 4Onkologische Praxis Kronach; 5Marienhospital Stuttgart; 6Health Center St. Marien, Amberg. #3519 Background: We investigated the expression of the EGFR ligands amphiregulin (AREG) and epiregulin (EREG) as well as the amplification of the EGFR-gene in tumor specimens of mCRC patients (pts) treated first-line with anti-EGFR targeted cetuximab together with CAPOX or CAPIRI. Expression levels were correlated with overall response rate (ORR), progression free survival (PFS) and overall survival (OS) to determine their relationship with effectiveness in this setting. Methods: A total of 185 mCRC pts were randomized to cetuximab (400mg/m² day 1, followed by 250mg/m² weekly) plus CAPIRI (irinotecan 200mg/m², day 1; capecitabine 800mg/m² twice daily days 1-14, every 3 weeks; 20% dose reduction of both agents for pts older than 65 years) or plus CAPOX (oxaliplatin 130mg/m² day 1; capecitabine 1000mg/m² twice daily days 1-14, every three weeks). The primary study endpoint was ORR. KRAS mutational status did not correlate with treatment outcome. The cut-offs for EGFR-amplification using FISH, AREG and EREG levels determined by RT-qPCR were calculated using ROC analysis for ORR. Results: Within the subgroup of KRAS wildtype tumors, analysis of EREG- and AREG-expression was possible in 99 pts and of EGFR-amplification in 63 pts. Higher AREG levels correlated significantly with higher ORR (83% vs 46%, p=0.006, OR 0.31), longer PFS (9.6mo vs 4.9, p<0.001, HR 0.35) and longer OS (39.9mo vs 17.2mo, p<0.001, HR 0.36). Higher EREG levels showed a significant correlation with ORR (74% vs 47%, p=0.036, OR 0.54), longer PFS (7.9mo vs 4.9mo, p=0.026, HR 0.57) and OS (33.0mo vs 20.2mo, p=0.041, HR 0.57). EGFR-amplification correlated significantly with higher ORR (71% vs 33%, p=0.004, OR 0.49), longer PFS (8.4mo vs 4.6mo, p=0.004, HR 0.50) and longer OS (30.5mo vs 15.2mo, p=0.001, HR 0.44). Study Objectives Primary Study Results Progression-Free Survival Times Overall Survival Times Amphiregulin (AREG) Amphiregulin (AREG) Survival Times by KRAS Status Laser- microdissection of FFPE tumor-cells Amphiregulin (AREG) 3´-cggagaatgcaaatatatagagcac-5´ 3´-caccgaaatattcttgctgaca-5´ Epiregulin (EREG) 3´-tggtctcttcactcaggtctca-5´ 3´-cgtgagttggcatagggaac-5´ Houskeeping RNA´s: ß-actin and GAPDH ROC-Analysis for ORR Epiregulin (EREG) Epiregulin (EREG) ROC analysis was carried out, using EREG and AREG mRNA expression levels in relation to the housekeeping RNA (ß-actin and GAPDH) and EGFR copy number in relation to chromosome 7 as continious test variables and ORR as state variable Design of Investigation Moosmann et al JCO 2011 RECIST Response by KRAS Status • AIO CRC-0104 trial recruited patients during the years 2000-2006, independent of the KRAS mutational status • tumor specimen of 99 KRAS wildtype patients were available for investigation • Retrospective analyses of tumor material was done, looking for molecular factors predictive for response to Cetuximab- based treatment EGFR-FISH EGFR-FISH AIO CRC-0104 Study Design Moosmann et al JCO 2011 CAPIRI + Cetuximab Response Data Metastatic colorectal cancer EGFR-FISH commercialy available test staining chromosome 7 (528nm orange) and EGFR (572nm green) to evaluate the frequency of EGFR per cell („gene copy number“) and the relative frequency in relation to chromosome 7 R CAPOX + Cetuximab CAPIRI + Cetuximab (*) Capecitabine 800 mg/m² oral BID day 1-14, q 3wks Irinotecan 200 mg/m² iv, 30 min day 1, q 3wks Cetuximabinitial dose 400 mg/m² iv, 120 min, then 250 mg/m² iv,60 min, wkly CAPOX + CetuximabCapecitabine 1,000 mg/m² oral BID day 1-14, q 3wks Oxaliplatin 130mg/m² iv, 120 min day 1, q 3wks Cetuximabinitial dose 400 mg/m² iv, 120 min, then 250 mg/m² iv,60 min, wkly * 20% dose reduction for patients > 65 years in the XELIRI + Cetuximab arm. Conclusions • In the treatment setting of cetuximab combined with CAPIRI or CAPOX, AREG, EREG and EGFR-amplification predicted treatment efficacy. • Within the subgroup of pts with KRAS wildtype tumors, EGFR-FISH and AREG expression have the strongest relationship with treatment efficacy. significant differences are indicated by * and italic and bold writing; PD (progressive disease), SD (stable disease), PR (partial remission) and CR (complete remission) were evaluated using RECIST criteria. ORR (objective response rate = CR + PR) and DCR (disease control rate = ORR + SD) were calculated