Download
1 / 34
340 likes | 489 Views
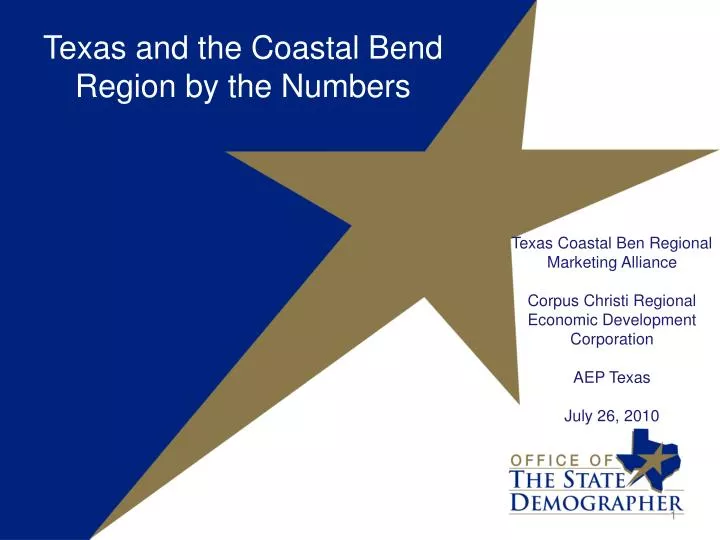
Texas and the Coastal Bend Region by the Numbers. Texas Coastal Ben Regional Marketing Alliance Corpus Christi Regional Economic Development Corporation AEP Texas July 26, 2010. 25 Million Reasons to be Proud of Texas (among a few more). Demographic Highlights TEXAS is:

E N D
Texas and the Coastal Bend Region by the Numbers Texas Coastal Ben Regional Marketing Alliance Corpus Christi Regional Economic Development Corporation AEP Texas July 26, 2010
25 Million Reasons to be Proud of Texas (among a few more) Demographic Highlights TEXAS is: big. The population of Texas is the second largest in the United States, approaching 25 million people (estimated population of 24.8 million people in 2009).7 young. Approximately 28% of Texas’ population is under 18 and only 10% of the population is older than 65 years.1 Webb County in Texas, has the youngest population in the U.S. with children younger than 5 comprising 12.8% of the population.7 embracing of culture and diversity. Approximately 9 million or 38% of Texans are of Hispanic descent, 2.8 million or 12% are African Americans, and 1 million or 4% are other (non-Anglo mainly of Asian descent).1 In about a decade, it is expected that Texas’ population will have more persons of Hispanic descent than any other racial or ethnic group.4 a desired place to live and work. Net in-migration to Texas accounts for almost half of the population growth in recent years.1 More than 171,900 college graduates moved into Texas each year between 2006 and 2008, placing Texas as 2nd in the Nation by this measure. urban. Texas has three of the top 10 largest cities in the Nation.3 Several of the metropolitan areas in Texas are among the most rapidly growing in the Nation.5 rural. Texas is the second largest state in the Nation in terms of square miles (268,601) and approximately 17% of the population lives in rural areas.1 a working state. Texas has a civilian labor force of more than twelve million workers and an unemployment rate lower than in most States.6 family oriented. Texas ranks 3rd among states for the percent of households which are married-couple families with children (24.4%).2 multigenerational. Texas ranks 3rd among states for percent of households which are multigenerational (4.5%).2 growing – fast. Texas gained more population than any other state in the last estimate year (between July 1, 2008 and July 1, 2009), adding 478,000 people.7Among cities over 100,000 population in the U.S., 4 of the 10 fastest growing areas are in Texas (2007-2008 change).7 Data sources: 1. Texas State Data Center, Population Estimates; 2. U.S. Census Bureau, American Community Survey; 3. U.S. Census Bureau, 2000 Census; 4. Texas State Data Center, Population Projections; 5. U.S. Census Bureau, Metropolitan Statistical Area Estimates; 6. U.S. Bureau of Labor Statistics; 7. U.S. Census Bureau, Population Estimates
Total Population and Components of Population Change in Texas, 1950-2009
Natural Increase in Texas(Births minus Deaths) • Birth Rate: 16.8 per 1,000 vs. 14.0 for US (2ndhighest) • Death Rate: 6.8 per 1,000 vs. 8.3 for US (5thlowest) • Natural Increase: 10.0 per 1,000 vs. 5.7 for US (3rd highest) • Texas is young: • Median Age: 33.2 vs. 36.8 for US (2ndlowest) • Texas has a high total fertility rate (Children per woman) • 2.34 vs. 2.05 for US (4th highest) Source: National Center for Health Statistics, Vital Statistics Data, 2008http://wonder.cdc.gov/
Estimated Annual Net Migration to Texas, 2000 to 2009 Source: U.S. Bureau of the Census 2009 Estimates
Total Population in Texas Counties, 2009 Source: U.S. Census Bureau Population Estimates
Percent Change of Total Population in Texas Counties, 2000-2009 Population increase for Texas was almost 19% during this period Source: U.S. Census Bureau Population Estimates
Projected Percent Change of Total Population in Texas Counties, 2008-2040 Source: Texas State Data Center 2008 Population Estimates
Estimated domestic migration (2000-2008) by county as a percentage of 2000 population Source: Population Division, U.S. Census Bureau, March 19, 2009. Map produced by the Texas State Data Center
Estimated internationalmigration (2000-2008) by county as a percentage of 2000 population Source: Population Division, U.S. Census Bureau, March 19, 2009. Map produced by the Texas State Data Center
Estimated Unauthorized Immigrant Population by State of Residence: January 2009 and 2000 Source: U.S. Department of Homeland Security.
Projected Population Growth in Texas, 2000-2040 Year Source: Texas State Data Center 2008 Population Projections
Projected Population of Texas, 2010 Source: Texas State Data Center 2008 Population Projections. Population values are for April 1, 2010.
Percent of Population Growth and Projected Population Growth by Race/Ethnicity, Texas Source: U.S. Census Counts, and Texas State Data Center 2008 Population Projections, 0.5 Scenario
Projected Racial and Ethnic Percent Change, Texas, 2000-2040 Source: Texas State Data Center 2008 Population Projections , No Migration Scenario
Projected Racial and Ethnic Percent Change, Texas, 2000-2040 Source: Texas State Data Center 2008 Population Projections , ½ 1990-2000 Migration Scenario
Projected Racial and Ethnic Percent Change, Texas, 2000-2040 Source: Texas State Data Center 2008 Population Projections , 2000-2007 Migration Scenario
Projected Racial and Ethnic Percent Change, Texas, 2000-2040 Source: Texas State Data Center 2008 Population Projections , 1990-2000 Migration Scenario
Percent of the population less than 18 years of age by county, 2009 Source: U.S. Census Bureau. 2009 Population Estimates
Percent of 7-12 Grade Students Dropping Out by County, 2008 Source: Texas Education Agency
Percent of the Population Less than 18 Years of Age, Living Under Poverty for During Past 12 Months Source: U.S. Census Bureau
Median Household Income by County, 2006 Source: U.S. Census Bureau
Population Growth in the Coastal Bend Region, 1980-2040 (2000-2007 Migration Scenario) Sources: 1980-2000. U.S. Census Bureau Counts; 2008 Census Bureau Estimates; 2040: State Data Center 2000-2007 Migration Scenario Projection
Population Growth in the CoastalBend Region by Area, 1980-2040
Population by Age in the State of Texasand the Coastal Bend Region, 2008
Texas and Coastal Bend, • Racial and Ethnic Composition, 2007 Texas Coastal Bend Region Source: U.S. Bureau of the Census, 2007 American Community Survey Microdata File Counties Summated: Aransas,Bee,Brooks,Duvall,JimWells,Kenedy,Kleberg,LiveOak,McMullen,Nueces,Refugio,San Patricio
Educational Attainment in 2000 in Texas for Persons 25+ Years of Age By Race/Ethnicity Percent
Percent of the population 5 and over who speak English less than well by state, 2008 Source: American Community Survey, 2008
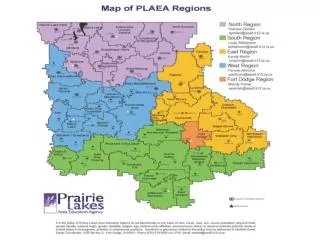
Major Points • Texas’ population will continue to grow, driven by both natural increase and net migration (internal and international) • The Hispanic origin population contributes substantially to overall growth of Texas’ population • The population will continue to increase in major urbanized areas and along the south Texas border, with declining population in most rural areas. • The Coastal Bend region has been generally experienced net out migration over the past decade and is projected to experience a slight population decline in the coming years.
Contact Office: 210-458-6530 Email: Lloyd.Potter@utsa.edu Lloyd Potter, Ph.D.