Download
1 / 16
160 likes | 268 Views
Spectral shape of solar particle events at energies above. 100 MeV / n. Catia Grimani University of Urbino – INFN Florence Italy In collaboration with : M. Fabi , N. Finetti , M. Laurenza , M. Storini ECRS 2012 Moskow July 5th 2012. Outline. LISA-PF

E N D
Spectralshapeofsolarparticleevents at energiesabove 100 MeV/n Catia Grimani Universityof Urbino – INFN Florence Italy In collaborationwith: M. Fabi, N. Finetti, M. Laurenza, M. Storini ECRS 2012 MoskowJuly 5th 2012
Outline • LISA-PF • GCR projections and SEP occurrence in 2015 • SEP differentialfluxtrend above 100 MeV/n • Conclusions
VACT1 VAC 100 kHz L Csens1 VM Cp L Csens2 VACT2 Cp LISA-PF inertialsensor and test mass
LISA-PF TEST masses and radiationmonitors 2siliconwafers of 1.4 x 1.05 cm2 area placed2 cm apart. Courtesyby A. Lobo
SUNSPOT PROJECTIONS IN 2015 CG et al., CQG, 2012 LISA-PF data taking PredictedSunspots in 2015: 59 5 and 95 percentile levels: 33 and 84 Solarmodulation parameterexpected variation: 350 MV/c - 800 MV/c Usoskinet al.,2005, 2011 http://solarscience.msfc.nasa.gov/predict.shtml
GCR projections in 2015 GC et al., CQG, 2012 and referencestherein f= 350 MV/c– 800 MV/c
SEP eventsduring LISA-PF Weconsiderhere SEP eventsassociatedwith a peakfluxequal or largerthan the minimum GCR background expected in 2015. Nymmik’smodel (Nymmik, 1999 a,b) allowsustopredict SEP occurrence (NSEPS) in termsofbotheventfluence and peakfluxes on the basisofexpectedyearly SS (NSS): NSEPS=0.0694 NSS SEP fluencedistributionisassumedtofollow a power-law trend withanexponentialdecreaseforlargefluences.
SEP projections in 2015 The numberofexpected SEP events at the timeof LISA-PF is: 1.1 min – 2.0 avg– 2.9 maxwithfluencesabove106protons/cm2 >30 MeV
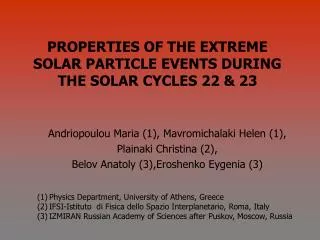
SEPsofdifferentintensities • February 23rd 1956: N24W74 • May 7th 1978: N23W72 • September 29th 1989: S27W90 • July 14th 2000: N22W07 • April 15th 2001: S20W85 • January 20th 2005: N14W61 • December 13th and 14th 2006: S06W23 and S06W46
GCR in 2015 and SEP events SEP EventFebruary 23rd 1956 Vashenyuket al., 2007 SEP Event December 13th and December 14th 2006 Adrianiet al., 2011
SEP fluxinterpolationfunctions (1) F(E)= A e-E/bParticles/[m2srsGeV(/n)] (2) F(E)= A E-gParticles/[m2srsGeV(/n)] (3) F(E)= A e-E/bE-gParticles/[m2srsGeV(/n)] Ellison and Ramaty, 1985
conclusions SEP energydifferentialflux interpolation during the wholeevolutionofvariousintensityeventsabove 100 MeV/nindicates (on average) that: the initialphaseof SEP eventsissometimesbetterrepresentedbyanexponential trend, however, in general, a power-lawmodulatedbyanexponential or power-laws and/or brokenpower-lawsbasicallyrepresentallphasesof the events.