Download

1 / 17
170 likes | 270 Views
Survey results from New Hope Baptist Church members on church renovation project. Insights on confidence in leadership, building plan, and willingness to support financially.

E N D
Renovation Survey Results New Hope Baptist Church Sunday, January 29, 2012
5. Occupational Status: Full-time employed 47.7% Part-time employed 7.0% Student 4.1% Homemaker 1.2% Retired 30.9% Seeking employment 4.1% Physically unable to work 4.9%
6. My (our) estimated annual household income is: $47,768 7. I attended one or more of the presentations of the project. Yes 58.7% No 41.3%
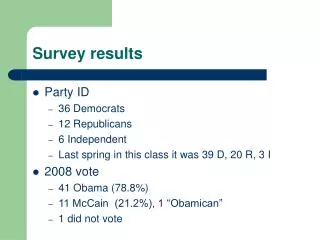
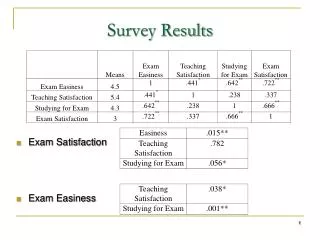
8. I have confidence in our church leadership as they give direction to this building project. Strongly Agree 42.9% Agree 40.0% Not Sure 13.1% Disagree 2.0% Strongly Disagree 2.0%
9. I have a clear understanding of Phase 1 of the proposed new building plan. Strongly Agree 34.7% Agree 40.0% Not Sure 20.4% Disagree 3.3% Strongly Disagree 1.6%
10. The Phase 1 building project, as currently outlined, represents a wise investment of funds for our church. Strongly Agree 25.9% Agree 39.5% Not Sure 24.3% Disagree 7.8% Strongly Disagree 2.5%
11. Please rank in order of importance the following portions of our building plan (#1= most important, #4= least important): 1.4 Expanded restrooms (#1=170 times) 2.5 Nursery upgrade (#1=32 times) 3.3 Expanded lobby (#1=9 times) 2.5 Sanctuary updates (#1=45 times)
12. We should conduct a capital giving campaign to challenge our congregation to financially support the project. Strongly Agree 23.5% Agree 43.7% Not Sure 21.5% Disagree 6.9% Strongly Disagree 4.5%
13. I believe this is the right time to proceed with a capital giving campaign for the building project. Strongly Agree 16.9% Agree 34.2% Not Sure 31.3% Disagree 11.5% Strongly Disagree 6.2%
14. I am willing to financially support the proposed project. Strongly Agree 23.7% Agree 50.6% Not Sure 18.3% Disagree 5.8% Strongly Disagree 1.7%
We have an extraordinarily high rate of current giving (7.4% of household incomes) • 74.3% of survey respondents are “willing to financially support the proposed project.” This is well above the 60% minimum threshold recommended by the consultant. Interpretations
The congregation has a relatively high confidence and support level toward church leaders. There is substantial goodwill in the congregation for the current leadership. Interpretations
A majority of those interviewed believe that the time to proceed from an “internal” standpoint is now. • There is an “external” concern regarding proceeding in the current economy. The vast of majority of interviewees see no real benefit to wait to proceed with a capital campaign. Interpretations
$1,250,000 Project - $350,000 Cash on Hand - $300,000 Budgeted over next 3 years _______________ $600,000 Campaign (With $50K church contingency)