Download
1 / 13
160 likes | 346 Views
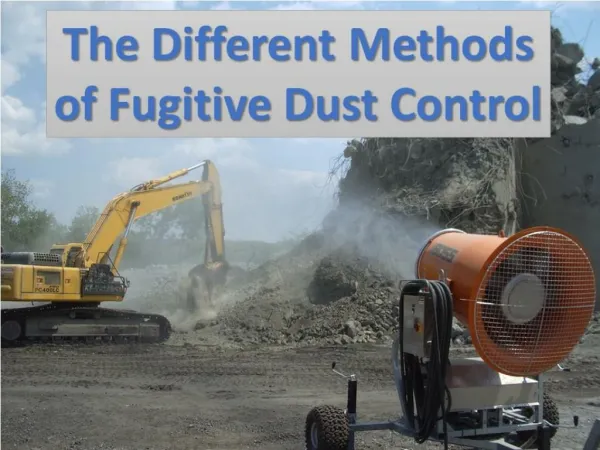
Impact of fugitive dust emissions from cement plants on nearby communities. 水土保持學所 79842001 劉昱麟. Introduction. The main objective of the present study was to assess the impact of the existing cement plant on the nearby community

E N D
Impact of fugitive dust emissions from cement plants on nearby communities 水土保持學所 79842001 劉昱麟
Introduction • The main objective of the present study was to assess the impact of the existing cement plant on the nearby community • The dust emissions associated with the cement plant were investigated to ensure that the plant meet the air quality standards • This paper will be useful for the cement industry, regulatory agencies, research organizations, consultants and all those concerned with monitoring and control of dust pollution
Fugitive Dust Model • a computerized air quality model specifically designed for computing impacts from fugitive dust sources • Data requirements for FDM : 1. Dust emission sources 2. Particle fractions and density data 3. Receptor location 4. Meteorological data 5. Miscellaneous data
Dust emission sources Cement grinding operation Kiln stacks Trucks Stockpiles Limestone crushing operation Limestone conveyor belt 62.9% 21.7% 8.3% 3.1% 2.9% 0.6%
Meteorological data 風速 風向 氣溫 穩定度 (Pasquill穩定度等級分類) 混合層高度(Holzworth法估計)
Miscellaneous data 粒徑分級 地表粗糙度 特徵粒徑密度 平均時間 氣象資料時段 模擬時段數 風速計離地高度
Result and discussion House 1 濃度值 : 312.08 ~ 423.83μg/m³ House 2 濃度值 : 196.19 ~ 358.91 μg/m³ House 3 濃度值 : 203 ~ 259.6 μg/m³ > WHO guideline value : 120μg/m³ These results revealed that the cement plant activities had impact on the air quality of the nearby residential houses
The modeling results tended to under predict the measured concentrations at all receptors The value of the correlation coefficient for FDM was calculated as 0.9189, which showed a good agreement between measured and predicted values
Show the contours (isopleths) of predicted 24-h average TSP concentrations
The FDM results tended to under-predicted the measured concentrations. However, the results of the comparison showed that performed well in predicting dust concentrations and that the model was adequate for application at the cement plant • The study that is also recommended for investigation is the determination of the worst-case scenarios that lead to the highest concentrations of dust in the area • Such studies will allow scientists to gain a better insight about FDM behavior, and to assess the reliability and accuracy of model predictions