
Understanding Digital Imaging: Devices, Formats, and Challenges
E N D
Presentation Transcript
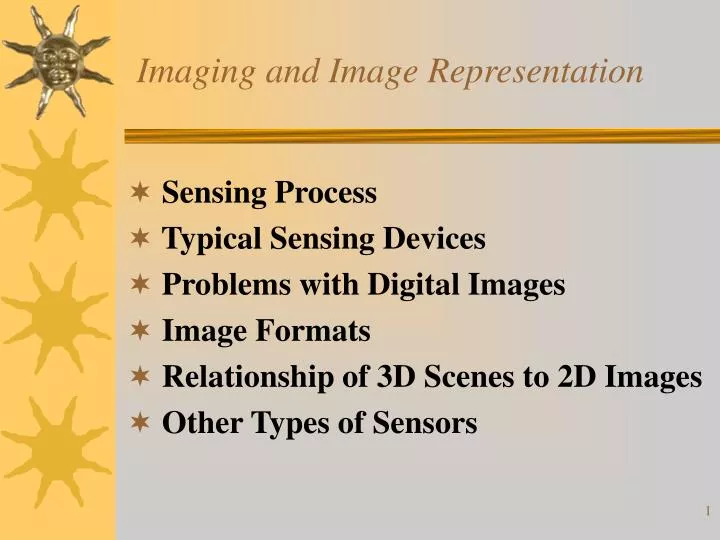
Imaging and Image Representation • Sensing Process • Typical Sensing Devices • Problems with Digital Images • Image Formats • Relationship of 3D Scenes to 2D Images • Other Types of Sensors
Images: 2D projections of 3D • The 3D world has color, texture, surfaces, volumes, light sources, objects, motion, … • A 2D image is a projection of a scene from a specific viewpoint.
Images as Functions • A gray-tone image is a function: g(x,y)= val or f(row, col) = val • A color image is just three functions or a vector-valued function: f(row,col) =(r(row,col), g(row,col), b(row,col))
Digital images (or just “images”) are typically stored in a matrix • Different coordinate systems (x,y) vs. (i=row,j=column) • Helpful to use macros to convert when coding things up Image vs Matrix
Imaging Process • Light reaches surfaces in 3D • Surfaces reflect • Sensor element receives light energy • Intensity counts • Angles count • Material counts What are radiance and irradiance?
Radiometry and Computer Vision* • Radiometry is a branch of physics that deals with the • measurement of the flow and transfer of radiant energy. • Radiance is the power of light that is emitted from a • unit surface area into some spatial angle; • the corresponding photometric term is brightness. • Irradianceis the amount of energy that an image- • capturing device gets per unit of an efficient sensitive • area of the camera. Quantizing it gives image gray tones. • From Sonka, Hlavac, and Boyle, Image Processing, Analysis, and • Machine Vision, ITP, 1999.
CCD type camera:Commonly used in industrial applications • Array of small fixed elements • Can read faster than TV rates • Can add refracting elements to get color in 2x2 neighborhoods • 8-bit intensity common
Blooming Problem with Arrays • Difficult to insulate adjacent sensing elements. • Charge often leaks from hot cells to neighbors, making bright regions larger.
8-bit intensity can be clipped • Dark grid intersections at left were actually brightest of scene. • In A/D conversion the bright values were clipped to lower values.
Lens distortion distorts image • “Barrel distortion” of rectangular grid is common for cheap lenses ($50) • Precision lenses can cost $1000 or more. • Zoom lenses often show severe distortion.
Resolution • resolution: precision of the sensor • nominal resolution: size of a single pixel in scene • coordinates (ie. meters, mm) • common use of resolution: num_rows X num_cols • (ie. 515 x 480) • subpixel resolution: measurement that goes into • fractions of nominal resolution • field of view (FOV): size of the scene a sensor can • sense
Resolution Examples • Resolution decreases by one half in cases at left • Human faces can be recognized at 64 x 64 pixels per face
Image Formats • Portable gray map (PGM) older form • GIF was early commercial version • JPEG (JPG) is modern version • Many others exist: header plus data • Do they handle color? • Do they provide for compression? • Are there good packages that use them or at least convert between them?
PGM image with ASCII info. • P2 means ASCII gray • Comments • W=16; H=8 • 192 is max intensity • Can be made with editor • Large images are usually not stored as ASCII
PBM/PGM/PPM Codes • P1: ascii binary (PBM) • P2: ascii grayscale (PGM) • P3: ascii color (PPM) • P4: byte binary (PBM) • P5: byte grayscale (PGM) • P6: byte color (PPM)
JPG current popular form • Public standard • Allows for image compression; often 10:1 or 30:1 are easily possible • 8x8 intensity regions are fit with basis of cosines • Error in cosine fit coded as well • Parameters then compressed with Huffman coding • Common for most digital cameras
From 3D Scenes to 2D Images • Object • World • Camera • Real Image • Pixel Image
Other Types of Sensors:Orbiting satellite scanner • View earth 1 pixel at a time (through a straw) • Prism produces multispectral pixel • Image row by scanning boresight • All rows by motion of satellite in orbit • Scanned area of earth is a parallelogram, not a rectangle
Human eye as a spherical camera • 100M sensing elts in retina • Rods sense intensity • Cones sense color • Fovea has tightly packed elts, more cones • Periphery has more rods • Focal length is about 20mm • Pupil/iris controls light entry
Surface data (2.5D) sensed by structured light sensor • Projector projects plane of light on object • Camera sees bright points along an imaging ray • Compute 3D surface point via line-plane intersection
Magnetic Resonance Imaging • Sense density of certain chemistry • S slices x R rows x C columns • Volume element (voxel) about 2mm per side • At left is shaded image created by “volume rendering”
Single slice through human head • MRIs are computed structures, computed from many views. • At left is MRA (angiograph), which shows blood flow. • CAT scans are computed in much the same manner from X-ray transmission data.
LIDAR also senses surfaces • Single sensing element scans scene • Laser light reflected off surface and returned • Phase shift codes distance • Brightness change codes albedo
Other variations • Microscopes, telescopes, endoscopes, … • X-rays: radiation passes through objects to sensor elements on the other side • Fibers can carry image around curves; in bodies, in machine tools • Pressure arrays create images (fingerprints, butts) • Sonar, stereo, focus, etc can be used for range sensing (see Chapters 12 and 13)
Where do we go next? So we’ve got an image, say a single gray-tone image. What can we do with it? The simplest types of analysis is binary image analysis. Convert the gray-tone image to a binary image (0s and 1s) and perform analysis on the binary image, with possible reference back to the original gray tones in a region.