Analyzing Recent Economic Trends in Massachusetts
180 likes | 201 Views
Explore essential industries and employment trends in Massachusetts from 2001 to 2005, highlighting critical sectors and job vacancy rates. Understand the criteria for selecting critical industries and delve into the details of Professional & Technical Services industries.

Analyzing Recent Economic Trends in Massachusetts
E N D
Presentation Transcript
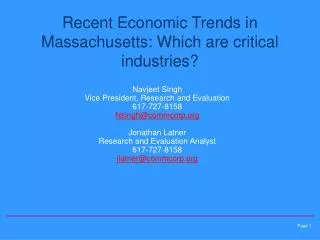
Recent Economic Trends in Massachusetts: Which are critical industries? • Navjeet Singh • Vice President, Research and Evaluation • 617-727-8158 • Nsingh@commcorp.org • Jonathan Latner • Research and Evaluation Analyst • 617-727-8158 • jlatner@commcorp.org Page 1
Massachusetts Employment Trends Employment is recovering from recession, but has not equaled its peak of Feb ‘01 Source: Bureau of Labor Statistics CES Data, Seasonally Adjusted Data Note: Recession Dates According to NBER Page 2
Do We Have Enough Workers Now? Many people are seeking work • In July ’06, 147,800 fewer employed than at peak Feb ’01 • From 2000 to 2005: • 36,000 fewer people • 70,000 fewer people in the labor force • 69,000 more “unemployed” • 32,000 more working part- time • 11,000 more “marginally” attached –stopped looking for jobs recently: • 5,000 more “discouraged” • 6,000 more stopped due to family or transportation reasons • From 2000 to 2004 • 47,500 more contractors or “non-employer” businesses in 2004 than in 2000 Note: Based on 12 month averages from Current Population Survey (CPS) Source: BLS (CPS) & Census (Non-employer) Source: Census Population Estimates Page 3
Massachusetts Employment 2005 Healthcare is the largest Industry Source: Bureau of Labor Statistics QCEW/ES-202, 2005 Annualized Data Page 4
Which of the industries share of employment in Massachusetts is high Indicates relative strength: Mgmt. Of Companies, Information, Prof. Tech. Svcs., Finance, & Healthcare Source: BLS QCEW, 2005 Annualized Data for MA & US Page 5
Employment Trends (2001-2005): Since Peak Employment Very few industries growing: Healthcare, Education, Hotels/ Food Services, and Other Services Source: Bureau of Labor Statistics ES-202, 2001, 2005 Annualized Data Page 6
Employment Trends (2004 – 2005): More Widespread Growth Source: Bureau of Labor Statistics ES-202, 2004, 2005 Annualized Data Page 7
The economy is turning around! Employment Trends (2001 – 2005) Employment Trends (2004 – 2005) Source: Bureau of Labor Statistics ES-202, 2001, 2004, 2005 Annualized Data Page 8
Massachusetts Job Vacancy Rate by Industry Q4, 2005 Highest vacancy rates: Professional/Tech Services, Retail (only in 4Q), Healthcare, Real Estate Source: MA DWD Job Vacancy Survey, Q4, 2005 Page 9
Selecting “critical industries” • What criteria to use? • What relative importance or weight should be given to different criteria? • When we use selected criteria what industries rise to the top? Page 10
What criteria to use? • What criteria can we use to select critical industries? • Some options, rank your top five choices: • in which Massachusetts is strong (strong meaning?) • In which employment is high (how high?) • in which there has been long-term or short-term growth • which pay well • which have entry level jobs with growth opportunities • have a lot of vacancies • are projected to grow Page 11
Details on Professional & Technical Services Industries & Occupations Page 12
Professional & Technical Services • Employment Peaked in December, 2000 • Employment Reached bottom in March, 2003 (12% Loss) • One of the few industries projected to grow in the next 5 years Source: MA DWD CES Data, Seasonally Unadjusted Data Note: Recession Dates According to NBER Page 13
What Defines Professional & Technical Services? 2002 North American Industry Classification System (NAICS) Source: Census Bureau Page 14
What is included in Professional & Technical Services 2005 Employment Source: Bureau of Labor Statistics ES-202, 2005 Annualized Data Page 15
Professional & Technical Services Medium & Short Term Employment Trends Employment Trends (2001 – 2005) Employment Trends (2004 – 2005) Source: Bureau of Labor Statistics ES-202, 2001, 2004, 2005 Annualized Data Page 16
What are the Major Occupations in Professional & Technical Services? Most of the occupations that work in this industry are highly educated, but there are those that do not require a Bachelor’s Degree Source: MA DWD Occupational-Industry Crosswalk Page 17
What are the Top 5 Occupations in Professional & Technical Services? Source: MA DWD Occupational-Industry Crosswalk Page 18