Download
1 / 20
200 likes | 326 Views
Local Employment Dynamics (LED) Online Toolset. For the Workforce Information in Regional Economic Development Conference ETA Regions 4 and 6, Phoenix, Arizona April 10-11, 2008 Matthew Graham matthew.r.graham@yahoo.com Geographer LEHD Program U.S. Census Bureau. Overview of Session.

E N D
Local Employment Dynamics (LED) Online Toolset For the Workforce Information inRegional Economic Development Conference ETA Regions 4 and 6, Phoenix, Arizona April 10-11, 2008 Matthew Graham matthew.r.graham@yahoo.com Geographer LEHD Program U.S. Census Bureau
Overview of Session • Whirlwind Tour of LED • Using the Tools • QWI Online • Industry Focus • OnTheMap • Other Data Resources • Q & A
Local Employment Dynamics • Voluntary partnership between states and Census Bureau • States supply quarterly worker and business wage records • Census Bureau merges state records and other data to produce information about jobs, workers, industries and your local economy
Use existing data to link multiple sources Create new data and products Reduce cost and respondent burden Make data available while protecting confidentiality The Concept – Data Integration LEHD & LED New data and products
The LED Partnership • Local Employment Dynamics (LED) • 48 state partners, including DC • 3 states yet to join - CT, MA, NH • Quarterly Workforce Indicators (QWI) • 43 states under Regular Production • 3 states under Experimental Production • OnTheMap • 17 states in Version 1, completed December 2006 • 42 states in Version 2, completed September 2007 • Up to 46 states in Version 3, coming in 2008
Local Employment Dynamics’Online Tools http://lehd.did.census.gov/
QWI Online • 8 QWIs, including: • Employment • Earnings • Hires • Separations • Turnover • Analyzed by: • Geography, industry, gender, age, and time
QWI Online – Flagship Product Shows most recent quarter of data NAICS and SIC option Links to available states
Interactive QWI Online Entries updated instantaneously 8 age categories 2-, 3-, and 4-digit NAICS code
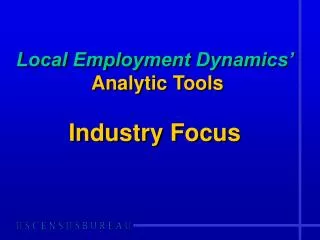
Industry Focus Ranking and multiple indicator selection Select age and gender State, county, Workforce Investment Areas (WIA), metro areas
Industry Focus provides… Easy, intuitive selection criteria and economic indicators for your geography, work force, and industry. Click on industry to see workforce characteristics.
OnTheMap • An online mapping tool currently featuring: • 42 states • Shows where residents work and where workers live, with reporting capabilities • Includes cross-state work flows and many geographic layers: • Counties, cities/towns, Metro areas, 110th Congress, WIAs, WIRED Regions, Tribal Lands, etc. • Version 3 bring rolled out this summer…
OnTheMap: Where People Go to Work Where do people who live in the path of the tornado work?
OnTheMap: Where Workers Live Where do workers employed at jobs located in the path of the tornado live?
OnTheMap Key Points • Not yet national in scope. • Does not include military, self-employed, or federal workers. • Data in OnTheMap is refreshed annually. Not all states supply data at the same rate. • OnTheMap reports top 10 cities/towns, top 10 counties, and top 3 states for sheds. • OnTheMap shows cross-state labor sheds for all available partner states. • OnTheMap shows commute sheds only within states, not across state boundaries.
Other Resources for LED’s Data • Downloadable OnTheMap data • Origin-Destination Tables & Area Characteristics to Census Block level. • Downloadable QWI data • Older Worker Profiles • eLearning Modules
Contact Us • Program Manager: Jeremy.S.Wu@census.gov • Marketing and Training: Colleen.D.Flannery@census.gov • General Comments/Suggestions did.local.employment.dynamics@census.gov • Website http://www.census.gov (Local Employment Dynamics) http://lehd.did.census.gov