Download
1 / 1
30 likes | 354 Views
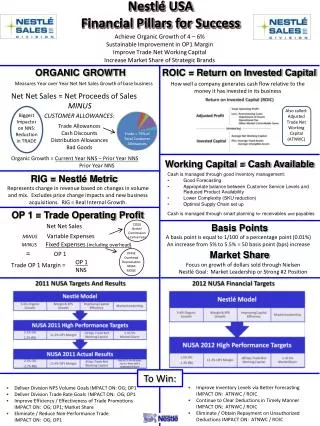
Nestlé USA Financial Pillars for Success. Achieve Organic Growth of 4 – 6% Sustainable Improvement in OP1 Margin Improve Trade Net Working Capital Increase Market Share of Strategic Brands. ORGANIC GROWTH. ROIC = Return on Invested Capital.

E N D
Nestlé USAFinancial Pillars for Success Achieve Organic Growth of 4 – 6% Sustainable Improvement in OP1 Margin Improve Trade Net Working Capital Increase Market Share of Strategic Brands ORGANIC GROWTH ROIC = Return on Invested Capital • Measures Year over Year Net Net Sales Growth of base business How well a company generates cash flow relative to the money it has invested in its business Net Net Sales = Net Proceeds of Sales MINUS Organic Growth = Current Year NNS – Prior Year NNS Prior Year NNS Also called: Adjusted Trade Net Working Capital (ATNWC) CUSTOMER ALLOWANCES: Trade Allowances Cash Discounts Distribution Allowances Bad Goods Biggest Impactor on NNS: Reduction in TRADE Trade = 79% of Total Customer Allowances Working Capital = Cash Available • Cash is managed through good inventory management: • Good Forecasting • Appropriate balance between Customer Service Levels and Reduced Product Availability • Lower Complexity (SKU reduction) • Optimal Supply Chain set up • Cash is managed through smart planning for receivables and payables RIG = Nestlé Metric Represents change in revenue based on changes in volume and mix. Excludes price change impacts and new business acquisitions. RIG = Real Internal Growth. OP 1 = Trade Operating Profit Net Net Sales MINUSVariable Expenses MINUSFixed Expenses (including overhead) = OP 1 Trade OP 1 Margin = Basis Points COGS Broker Commission License Fees A basis point is equal to 1/100 of a percentage point (0.01%) An increase from 5% to 5.5% = 50 basis point (bps) increase Market Share PFME Overhead DepreciationNIMA MOGE OP 1 NNS Focus on growth of dollars sold through Nielsen Nestlé Goal: Market Leadership or Strong #2 Position To Win: • Improve Inventory Levels via Better Forecasting IMPACT ON: ATNWC / ROIC • Continue to Clear Deductions in Timely Manner IMPACT ON; ATNWC / ROIC • Eliminate / Obtain Repayment on Unauthorized Deductions IMPACT ON: ATNWC / ROIC • Deliver Division NPS Volume Goals IMPACT ON: OG; OP1 • Deliver Division Trade Rate Goals IMPACT ON: OG; OP1 • Improve Efficiency / Effectiveness of Trade Promotions IMPACT ON: OG; OP1; Market Share • Eliminate / Reduce Non-Performance Trade IMPACT ON: OG; OP1