Download
1 / 17
170 likes | 291 Views
Location of BLMs in the LHC. The BLM system (short overview) Data from the BLM system Installation in the arcs Installation in the insertion regions. Purpose of the BLM system. Machine protection against damage of equipment and magnet quenches Setup of the collimators

E N D
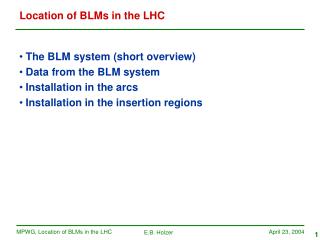
Location of BLMs in the LHC • The BLM system (short overview) • Data from the BLM system • Installation in the arcs • Installation in the insertion regions
Purpose of the BLM system • Machine protection against damage of equipment and magnet quenches • Setup of the collimators • Localization of beam losses and help in identification of loss mechanism • Machine setup and studies
Signals from the BLM system • Dump signal • Logging • Post mortem
Logging Data Arrangement These data have to be read with a rate of a second in order to be stored in a database as well as to give a graphical representation for the control room. • The card’s Threshold table. (~ 22 KBytes) • The measured & calculated data. (< 2 KBytes) • The used Threshold values. (< 1 KBytes) • The max of read values ( 100 Bytes) • Additional info (card ID, status, errors) ( ~16 Bytes) Total from each card ~ 28KB per minute From C. Zamantzas, not jet implemented – under discussion.
How a Control Room Representation could look The Control Room will be able to issue the Warning level alertsfrom logging data and have a graphical representation: The 12 values measured for each detector have to be normalised by their corresponding threshold value; from those 12 the maximum value is displayed. From C. Zamantzas, not implemented.
Post Mortem Data Recording • Two circular buffers • 2000 turns of both signals received • Integrals of 10 ms (data needed for further analysis) • Double the above system and toggle between them using the stop PM recording trigger • Never stop recording (i.e. avoid start input) • Test of PM will be possible anytime • Accidental/error-triggering proof • PM freeze from TTCrx through the backplane. • Time-Stamp appended later by crate CPU. • At PM freeze the CPU records the time and later when it reads the PM Data appends it to them. • Calculations: • 1000 turns 2000 acquisitions * ~250 bits frameword • 60 KB/signal * 2 signals/card = 120 KB /card • 120KB/card * 18 cards/crate = 2.1 MB /crate From C. Zamantzas, not jet implemented – under discussion.
BLM locations in the arcs – transverse plane • BLMs installed outside of the cryostat, maximal signal in horizontal plane (least amount of material). • Number of shower particles underneath the cryostat: ~10 times less than in horizontal plane. Phi (angle in transverse plane) distribution of particles exiting the vacuum vessel (GEANT simulation)
Loss location BLM position BLM locations in the arcs – longitudinal • 3 loss locations simulated: shower development through the cryostat, GEANT 3. • The positions of the BLMs are chosen to: • reduce difference between inside and outside loss • minimize crosstalk • distributed loss to resemble point loss • reduce difference with and without MDCO.
First simulation results on longitudinal proton loss distribution Tracking of tertiary halo particles, E.B. Holzer and V. Kain (end of 2003), complete aperture model (DS and arc right of IR7), (halo particles simulated by R. Assmann), ideal alignment. Longitudinal losses strongly peaked at the beginning of the quadrupoles (dipoles not shown).
BLM installation in the insertion regions • Collimation regions • ATLAS and CMS • Injection (ALICE and LHC B) • IR4 and IR6 Sketch with detector locations and number of monitors (G. Ferioli): BLMA (blue), BLMC (red), BLMS (black) … number of monitors per location Table with the BLMS (“SI” – ionization chamber, and “SS” – SEM) and BLMC (“CI” and “CS”) locations per insertion region. One side of IP only, has to be multiplied by two to get the number per IP, if not indicated differently. Only one beam, if not indicated differently.
Collimation regions Ionization chamber SEM BLMA (blue), BLMC (red), BLMS (black) … number of monitors per location Number of BLMS and BLMC locations One side of IP only, has to be multiplied by two to get the number per IP, if not indicated differently. Only one beam, if not indicated differently
Your input needed • BLM locations in IR3, IR7 and IR4 • Comments on the locations in IR1, IR2, IR5 and IR6