Hydrographic Changes in the Northern Gulf of Alaska: Insights from NE Pacific GLOBEC (1997-2004)
This study investigates interannual hydrographic changes in the northern Gulf of Alaska, focusing on temperature and salinity variations between 1997 and 2004. Utilizing data from the Northeast Pacific Long Term Observation Program, the research highlights significant seasonal and interannual shifts. The findings reveal notable freshening events, high salinity periods, and temperature fluctuations, particularly following an El Niño event. The study emphasizes the link between coastal freshwater discharge, alongshore wind stress, and hydrographic conditions, providing essential insights into changing marine environments.

Hydrographic Changes in the Northern Gulf of Alaska: Insights from NE Pacific GLOBEC (1997-2004)
E N D
Presentation Transcript
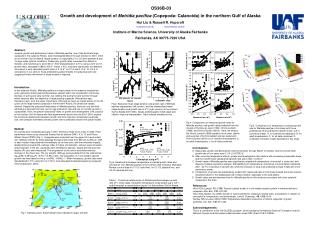
OS36B-10 Hydrographic changes in the coastal northern Gulf of Alaska during Northeast Pacific GLOBEC (1997-2004) Thomas C. Royer, Chester E. Grosch, Thomas J. Weingartner* and Seth Danielson* Center for Coastal Physical Oceanography, Old Dominion University, Norfolk, VA, 23529, U.S.A. *Institute of Marine Science, University of Alaska, P.O. Box 757220, Fairbanks, AK, 99775-7220, U.S.A. E-mail:royer@ccpo.odu.edu Interannual Changes in Hydrography Upper Layer Salinity Anomaly (0-100 m) The upper layer salinity anomaly (seasonal signal removed) (Fig. 2c) begins with a freshening in 1997-8 followed by abnormally high salinities in late 1998 at the midshelf locations and a relatively strong high salinity near to the coast in early 1999. Higher than normal salinities then follow until about 2003 when below normal salinities are found across the shelf through 2004. Lower Layer Salinity Anomaly (100-250 m) The salinity anomalies here (Fig. 2d) are very similar to the upper layer in timing, position and magnitude. Upper Layer Temperature Anomaly (0-100 m) Upper layer temperatures (Fig.3c) were elevated in ’97-’98 especially offshore near to the shelf break. High temperatures continued in 1998 especially at the shelf break and offshore. For 1999 - 2002, declining temperatures were present across the shelf followed by a rather abrupt warming in late 2002 into 2003 across the shelf. In late 2003, upper temperatures returned to normal. Lower Layer Temperature Anomaly (100-250 m) Similar to Fig. 3c, temperatures near the shelf break in ’97 were above normal (Fig. 3d). However, the nearshore deep water was relatively warm throughout 1998 especially within 40 km of the coast. The period between early 1999 and to early 2002 was one of near normal temperatures in the lower layer, followed by a sharp cooling in mid-late 2002 over the inner 2/3 of the shelf. A very brief warming over the inner half of the shelf occurred in Spring 2003 followed by a return to normal conditions thorough the end of the record. Possible Hydrographic Forcing Functions Coastal Freshwater Discharge The monthly coastal freshwater discharge has been determined over the Southeast and Southcoast regions of Alaska (after Royer, 1982) and recent, enhanced glacial ablation has been added (Arendt et al., 2002) (Fig. 4). Relative to the 74 year discharge record, the Feb. ‘99 discharge is one of the lowest especially since ablation is now included. In 2002 there are consistently low discharges from January through April. High discharges occurred in October (4th highest since 1931) and throughout the fall of 2002 (September (5th highest), October and November). Alongshore Wind Stress The monthly mean mesoscale alongshore stress at 59.5 N, 149.5 W (about GAK3) from NSCAT and QuikSCAT data (Fig. 5), contain 5 unusual events. The first (Dec.’97-Feb.’98) consisted of a positive wind stress (toward the east; upwelling) followed by a strong westward stress (downwelling). A similar event (positive followed by negative) took place from Nov.’03 to Feb.’04. The other three events were all negative (downwelling) and took place Feb.-Apr’00, Nov.’-Dec.’00 and Sept.’03-Jan.’04 (the most intense one). Figure 1. GLOBEC LTOP Seward Line Figure 2 Salinity Figure 3 Temperature Abstract a a The hydrographic conditions (temperature and salinity versus depth) during the GLOBEC sampling (October 1997-2004) across the shelf of the northern Gulf of Alaska reveal significant seasonal and interannual temperature and salinity changes during this period. The Northeast Pacific Long Term Observation Program (NEP LTOP) conducted approximately 6 cruises per year during the 7 year field program. The interdisciplinary sampling included depth profiles of salinity, temperature, photosynthetically available radiation (PAR), and light transmission across the Seward Line beginning at the mouth of Resurrection Bay and terminating off the shelf in the deep Gulf of Alaska. The initial sampling period took place shortly after an El Nino-Southern Oscillation (ENSO) event and a rapid temperature elevation was observed in early 1998 especially at depth (75-150 m) and centered approximately 80 km offshore. The water temperature at depth declined overall until 2003 when it rose to its highest level. As compared with the 34 year time series of temperature and salinity versus depth to 250 m at themouth of Resurrection Bay, Alaska (60 N, 149 W) (GAK 1), at 2 C above normal, it was the highest anomaly yet observed. However, it follows a general trend of increasing water temperatures throughout the water column. The salinity anomaly across the shelf in the 75-150 m depth range was relatively fresh in 1997-8 followed by increasing salinities to their maxima in 2000-2001 and then a return to more normal conditions. The abrupt warming in 2003 was accompanied by a freshening of 0.9, exceeding the 0.5 freshening that accompanied the 1997-8 ENSO event. Generally, the water temperatures have increased throughout the water column over the Seward Line during the LTOP period. During the same period, the salinity of the uppermost 100 m of the water column has decreased while the lower 150 m has a trend of increasing salinity. This is consistent with an increase in the stratification and baroclinic circulation over this shelf which likely affects production of the lower tropic levels. b b The Data Hydrographic sampling on 40+ cruises from October 1997 to December 2004.Northeast Pacific GLOBEC Long Term Observing Program (LTOP) (Fig. 1) (Weingartner, et al. 2002). The water column was divided into two layers representing a directly forced surface layer with the mixed layer (0-100 m) and a lower, more isolated, layer 100 – 250 m (or the bottom when < than 250 m). c c Seasonal Hydrography Upper Layer Salinity (0-100 m) The upper layer salinity (Fig.2a) (St. 1 at coast and 13 in deep water), has a narrow band of relatively freshwater ( less than 32) extending about 55-60 km offshore seasonally with the freshest water and maximum extent in the fall. The greatest nearshore salinity contrast occurred in fall 2002 with the least in fall 2000 and 2001. Offshore, the upper layer salinity has a seasonal maximum (>32.5) in the late winter/early spring. The highest salinities offshore occurred in early in both 2000 and 2001. No cross shelf temporal delays are apparent at least on a temporal scale of the cruises (one month or more). Lower Layer Salinity (100-250 m) The lower layer salinity (Fig.2b) has a coherent pattern of low salinity (<32.8) extending about 110 km offshore, usually most apparent in the late winter-early spring. The lower salinities occur later in the year than the upper layers. Offshore, there is an intrusion of high salinity water either coincident with or immediately following the nearshore low salinity intrusion. No consistent cross shelf time delays are noted. Upper Layer Temperature (0-100 m) There is seasonal warming across the shelf without a significant temporal delay (Fig. 3a). The maximum heating coincides with the late summer and the majority of this seasonal heating is solar. The warmest year is 1998, following the 1997-8 ENSO event with the coolest winter occurring in 2002. Lower Layer Temperature (100-250 m) The highest temperatures in the lower layer (Fig. 3b) occur seasonally after the high temperatures in the upper layer with the maximum temperatures are found at depth of in the midst of winter (Dec.-Mar.). This warm water is coincident with the low salinities seen in Fig. 2a and is likely a result of coastal downwelling and is found primarily at a similar distance offshore as the low salinity lower layer water (about 110 km). • Discussion • The negative upper layer salinity anomaly (Fig. 2c) is a response to cumulative high rates of freshwater discharge (Fig. 4) throughout Fall ‘97. In early ’99, relatively low freshwater discharge caused increased salinity out to about GAK 4. One of the highest rates of discharge followed in October but was modulated by the relatively quiescent, possibly upwelling winds (Fig.5). Moderate downwelling winds returned Feb.-Apr. ’00. However the salinity increases on the outer shelf were the result of a mesoscale eddy that impinged on the Seward Line in May ‘00 (Okkonen, et al, 2001). Late in ‘00 abnormally high salinities returned to the inner shelf out of phase with the higher than normal freshwater discharge that peaked in October ‘00. Possibly this is a consequence of the eddy that propagated across the shelf at this time. It could be that the eddy entered the offshore waters in Spring ‘00 causing the high salinities at the shelf break. Relatively low freshwater flows Jan.-Apr. ‘02 were not clearly reflected as an increased the upper layer salinity anomaly. This could be a consequence of the lack of wind strength for this period. The Fall ‘02 high discharge produces the strongest negative salinity anomaly at the coast out to GAK5 for late ‘02 and early ‘03. Upper and lower layer (Fig. 2d) salinity anomalies have a very similar temporal and spatial patterns, suggesting that alongshore advection plays an important role in their formation. • The temperature anomalies (Figs. 3c, 3d) have similar vertical coherences (maybe slightly less than salinity) but have more uniform cross-shelf spatial structures. The temperature anomalies are higher than normal in ‘97-8 especially at the shelf break. Since this was time of the ’97-8 ENSO event, it could be the result of the propagation of an alongshore Kelvin wave. A double signal, the first arriving in early ‘98 and the second about 9-10 months later coincides with the double SOI signal,accounting for the Kelvin wave propagation (Royer, 2005). Below normal temperatures in ‘02, are due to weak downwelling. Downwelling here forces warmer, upper layer water downward. Subsequently, the relatively strong downwelling in late ‘03-early ‘04 created a pool of relatively warm water across the shelf. • During the GLOBEC period at GAK1, the salinity anomaly in July ‘00 in the upper layer reached the second highest value (+0.61) in the 35 year hydrographic record. The salinity in the lower layer was the highest ever (+0.59) in March ‘00. • In Feb. ‘03, the upper layer temperature anomaly was highest (+2.28 C) in the 35 year record with the 2nd highest anomaly (+1.41 C) in Feb. ‘98 (ENSO conditions). These are consistent with the lower layer temperature anomalies of +1.90 C (highest) and +1.35 C (2nd highest) at the same times. The detection of the warmest waters at these depths at GAK 1 since 1970 could be a consequence of a finer temporal sampling though it could also be a consequence of long term increases in the water temperature throughout this water column (Royer, 2005). • Conclusions • Coastal freshwater discharge influences the salinity anomalies across the shelf in the northern Gulf of Alaska. • Mesoscale eddies occasionallycan play an important role in exchanging waters between the deep gulf and shelf. • El Nino (ENSO) events and local winds influence temperature anomalies. • Cross shelf ENSO propagation has been observed for the first time in the Gulf of Alaska. ENSO signals are largest at the shelf break and arrive there first. • Highest anomalies of salinity and temperature since ’70 were recorded at GAK1 during the GLOBEC sampling (’97-’04). d d References Arendt, A. A, et al., 2002. Science, 297: 382-386. Okkonen, S.R, et al., 2003. J.Geophy. Res.108, doi:10.1029/2002JC001342. Royer, T. C. 1982. J. Geophys. Res. 87:2,017-2,021. Royer, T.C., 2005. Deep Sea Res. II, 52, 267-288. Weingartner, T., et al. 2002, Oceanography Magazine 15:30-35. Figure 4. Coastal Freshwater Discharge Figure 5 Alongshore Wind Stress (speed^3) (positive eastward, offshore Ekman transport) Acknowledgements The satellite wind data products were provided by Isaac Schroeder. Funding was provided by the National Science Foundation and travel support for the Ocean Sciences meeting was provided by the U.S. Arctic Research Commission.