Download
1 / 12
120 likes | 290 Views
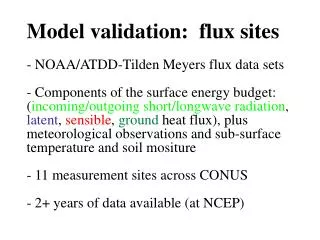
Model validation: flux sites. - NOAA/ATDD-Tilden Meyers flux data sets - Components of the surface energy budget: ( incoming/outgoing short/longwave radiation , latent , sensible , ground heat flux), plus meteorological observations and sub-surface temperature and soil mositure

E N D
Model validation: flux sites - NOAA/ATDD-Tilden Meyers flux data sets - Components of the surface energy budget: (incoming/outgoing short/longwave radiation, latent, sensible, ground heat flux), plus meteorological observations and sub-surface temperature and soil mositure - 11 measurement sites across CONUS - 2+ years of data available (at NCEP)
NOAA/ATDD Surface Flux Network FP SF BH BV,BP CV MO WB,CH GC AZ
NCEP model vs obs MAY 2007 average fluxes H LE Ft. Peck, MT
LST verification 07May2006 310 300
LE = D(Rn-G) + rcp(esfc - eair)/ra _______________________ D + g(1+rs/ra) Using surface fluxes to evaluate land-surface physics formulations and parameters Sensible heat flux (bulk aerodynamic form): H = rcpCh(Tsfc - Tair) Latent heat flux (i.e. Penman-Monteith form): For a fully-vegetated surface: Ch = exchange coefficient (=1/ra) rs = canopy resistance (inverse canopy cond.)
Transpiration processes/parameters: ...e.g., effect of vapor pressure deficit on canopy conductance: Bondville, Ill. flux site JULY 2006 soy beans(C3) corn (C4) canopy conductance (cm/s) current Noah test Noah Vapor pressure deficit (mb) T>20C,SWDN>600W/m2 · Better NLDAS results with new VPD option (next pages)
To reduce low LH biases during the Summer Vapor pressure deficit function Using a narrow range of thistends to overestimate the evaporation during wet periods (spring) and underestimate the evaporation during dry periods (summer). SMHIGH and SMLOW BXEXP From Chen et al. 1996
ARM/CART sites• Oklahoma Mesonet sites ARM/CART Experimental Design • CONTROL • TEST: Seasonal LAI Root Fraction Vapor Pressure Deficit Function SIMULATION PERIOD: OCT 1996 - SEP 1999
Averaged over 24 ARM/CART sites CONTROL TEST