Air Deposition Modeling and Analysis of Brake Pad Wear Debris Impact on Water Quality
This report details a comprehensive analysis of air deposition modeling focusing on brake pad wear debris and its effects on water quality. Key contributors include SFEI, Clemson University, and the U.S. EPA. The study emphasizes modeling methodologies, including coarse and fine resolution simulations, to estimate copper emissions from brake pads and other sources. It discusses the interaction of air deposition with watershed models, deposition fluxes, and the implications for the Castro Valley Creek Subwatershed. The results provide crucial data for environmental management and conservation efforts.

Air Deposition Modeling and Analysis of Brake Pad Wear Debris Impact on Water Quality
E N D
Presentation Transcript
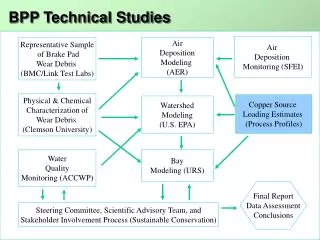
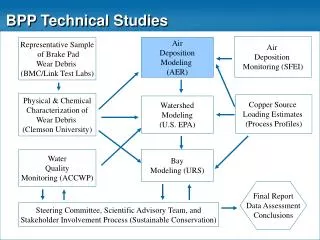
BPP Technical Studies Air Deposition Monitoring (SFEI) Representative Sample of Brake Pad Wear Debris (BMC/Link Test Labs) Air Deposition Modeling (AER) Physical & Chemical Characterization of Wear Debris (Clemson University) Copper Source Loading Estimates (Process Profiles) Watershed Modeling(U.S. EPA) Water Quality Monitoring (ACCWP) Bay Modeling (URS) Final Report Data Assessment Conclusions Steering Committee, Scientific Advisory Team, and Stakeholder Involvement Process (Sustainable Conservation)
Input Data to Air Deposition Model Air Deposition Modeling • Emissions • Transport • Deposition (wet + dry) • Coarse resolution modeling Bay Area monthly resolution background • Fine resolution modeling Castro Valley Creek Subwatershed daily resolution (Mar 2004-Feb 2005) local variability Brake and non-brake sources Copper Source Loading Estimates (Process Profiles) Affects wet and dry deposition fluxes Physical & Chemical Characterization of Wear Debris (Clemson University) Drives simulation of transport and deposition Meteorology data (source: NCDC)
Castro Valley Creek Subwatershed(Fine resolution simulation)
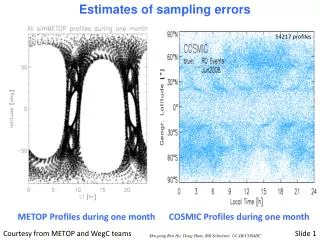
Comparison of Simulation Results with Deposition Measurements (SFEI)
Interaction with Watershed and Bay Models Air Deposition Modeling (AER) Provide wet and dry deposition fluxes of copper from brake pad and other air emissions • Daily resolution • Impervious vs. pervious surfaces • Much of the Castro Valley Creek Subwatershed is paved • Unpaved area is located higher in altitude and farther from major roads Watershed Modeling(U.S. EPA) Bay Modeling(URS) • Long-term • Direct deposition fluxes to the bay (regional)