Download
1 / 39
390 likes | 493 Views
The Eastern Mediterranean Transient studied with Lagrangian diagnostics applied to a Mediterranean GCM forced by satellite SST and ECMWF wind stress for the years 1988-1993. Volfango Rupolo a , Salvatore Marullo a and Daniele Iudicone b

E N D
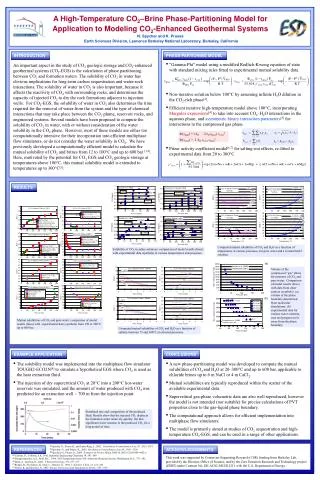
The Eastern Mediterranean Transient studied with Lagrangian diagnostics applied to a Mediterranean GCM forced by satellite SST and ECMWF wind stress for the years 1988-1993. Volfango Rupoloa, Salvatore Marulloa and Daniele Iudiconeb aC.R. Casaccia ENEA Rome, Italyb, Istituto di Fisica dell'Atmosfera-CNR, Rome, Italy (subm. to JGR) http://clima.casaccia.enea.it/staff/rupolo • After a long spin up phase (‘climatological’ field), the model is • forced using daily ECMWF wind stress and relaxing temperature to • daily satellite SST for the years from 1988 to 1993. (salinity • continues to be restored to climatological values) • The results are analysed computing: • Water mass formation rate • Transport in the straits (CretanArcs and Otranto Strait) and in the EM using Lagrangian diagnostics • Upwelling (transport and location) of the ‘uplifted water’
Geographical distribution of formation of water denser than 29.10, units are in 102m3sec-1Km-2 Water mass formation analysis: From 1989 to 1991, the Adriatic produce less and less dense water while the Aegean continues its ‘normal’ activity In 1992 and especially 1993 all basins enhances activity but the densest water is produced in the Aegean
Density at the Antickithera sill depth and at the bottom of Otranto Straits Dashed line: density at the Bottom level in the Otranto strait Full line: density at the sill level in the Cretan See (WCA) ‘Standard run’ Yearly mean No tracer drift. Interannual Variability is introduced after the 100th year of the spin up. Otranto overflow becomes lighter during winter 1992 and1993 Years from 1988 to 1993 Monthly mean
Yearly mean salinity vertical profiles: the decrease of inflow of salty intermediate water in the Adriatic precedes the change in the stratification in the Ionian (fully development of the EMT occurring in 1992 and 1993) (‘+’=1989, ‘*’=1990, ‘’=1991, ‘Δ’=1992 and ‘’=1993 Full line without symbols= ‘climatologic year’)
Density vertical section at 35° N, yearly mean values ‘climatologic’ year 1993 The general mechanism of the transient is reproduced
Salinity vertical section at 37.5° N, yearly mean values ‘climatologic’ year 1993 The general mechanism of the transient is reproduced Dashed area = S > 38.85 PSU
Particles initially sedded uniformly in the horizontal (300 <z 600 m) Left =1993, rigth=climatology In the climatology ADW is deeper and moves ciclonically in the Ionian. In 1993 the Aegean overflow is deeper and spreads in the Ionian developing energetic Coherent structures characterized by velocity O(10) cm/sec and L 100-200 Km
1993: about 60 000 particles are released at intermediate Depth. Colours indicate depth (blu 200 m, yellow 2700 m.) climatology
Lagangian Transport in the cretan Arcs. Sv W E Strait of Otranto Antikithera Strait O1 Kassos Strait O2 A1 A2 A£ A4 Sv From 1988 to 1993 about 1.2 1014 m3flow deeper than 600 m. From the Cretan Arcs (roughly the half of he estimate of Roether et al.; 1996) Considering only water flowing deeper than 1200 m in this period the Aegean is 4.5 times more active than Adriatic About the 80 % of this overflow occurs during 1992 and 1993. Integrated transport of overflow Deeper than 600 m. 1014 m3 1988 ----------1990----------1992---1993
1992 Strait of Otranto Antikithera Strait O1 Kassos Strait O2 A1 A2 A£ A4 1993 Deep overflow (> 1500 m) over the Antikithera Strait during 1992 and 1993 End of February
Subbasins transportestimates • To compute sub basins lagrangian transport estimate we consider • Three –four years long – velocity field: • Four iterated years representative of the ‘climatologic’ – or pre • EMT situation. (Clim4) • 2) Years from 1988 to 1991 (F4, representative in our simulation • of the pre conditioning phase) • 3) 1993 followed by three years inwhich the model is forced • with standard forcing (S4, useful to follow the propagation of • a single event of deep Aegean overflow)
Intermediate Water: Only particles starting from A1 reaching ending sections in less than 4 years and between 200 and 600 m. are considered. Green= ‘climatology’ (Clim4) Blu= preconditioning Phase (F4) Red = Fully developped EMT O1 0.11 2.0 0.03 0.8 0.11 0.4 SIC A1 A3 Note the transport values in the preconditioning phase Recirculation A1A3 persists in S4 0.04 2.9 0.48 1.7 0.40 1.7 0.01 2.8 0.12 1.7 0.30 1.6 In the pink boxes are indicated the mean arrival times
Deep Water: Only particles starting from A1and O1 and reaching ending section I37 deeper than 600 m. and 1500m in less than 4 years are considered. Mean arrival times and second row Green= ‘climatology’ (Clim4) Blu= preconditioning Phase (F4) Red = Fully developped EMT O1 0.33 0.06 2.8 0.10 < 0.01 – 0.25 0.05 1.1 A1 I37 <0.01 <0.01 – 0.26 < 0.01 – 0.42 0.15 0.8 In the pink boxes are indicated the mean arrival times for particles reaching I37 deeper than 1500 m.
Vertical section of particles coming from the Adriatic (red) And the Aegean (black)) clim4 Clim4 F4 S4
Kinetic energy in the deep (> 700 m) Ionian The maximum is reached after 50 days from the inset of the deep Aegena flow The succesive e-folding time is 150 days S4: 1993 + 3 years forced with climatological forcing
Upwelling through the nutricline: particles are released (homogeneously) at 160 m. of depth and they are integrated till they reach the depth of 30, 15 and 5 m. standard year 1993:Fully developped EMT From 160 to 5: 0.01 Sv From 160 to 5: 0.02 Sv From 160 to 15: 0.02 Sv From 160 to 15: 0.04 Sv From 160 to 300: 0.03 Sv From 160 to 300: 0.07 Sv
Time behavior of flux through the ‘nutricline’ Red = flux at the starting section, black= flux at the ending section standard year 1993 From 160 to 5: From 160 to 5: From 160 to 15: From 160 to 15: From 160 to 30: From 160 to 30:
Summary • Relaxing model SST to satellite SST from 1988 to 1993, the general • mechanism of the EMT is reproduced • Lagrangian diagnostics make easier the analysis of the development • of the EMT as it is represented by the model and allows quantitative • estimates, in particular: • In a preconditioning phase IW inflow in the Adriatic (Aegean) decreases (increases). Probably wind induced (Samuel et al, Demirov and Pinardi) • The EMT fully develops during 1992 and 1993, the overflow from the Aegean is concentrated during two events (O(months)). The total flow over the Cretan Arcs is 1.2 1014 m3(roughly the half of he estimate of Roether et al.; 1996) • Relaxation toward pre-EMT situatiuon (qualitative behavior and estimate of characteristic time) • Moreover: Quantitative estimates of vertical transport before and after the EMT (up lifted water), Time statistics • http://clima.casaccia.enea.it/staff/rupolo
Water mass formation rate Adriatic Aegean F()= [F()]=[Sv]
Particles are released from section 1 with some criterium (e.g. u>0, S<So) Each particle is integrated till up it reaches 2, 3 or recirculates in 1 The transport function relative to the transport ‘section to section’ is computed summing the contribution of each particle Note that the transport from 1 to 3 is different with or without 2 Lagrangian diagnostics in a OGCM Off line integration Transport section to section:Quantitative analysisWater path Tracers analysis Time statistics 2 1 3 1
Salinity vertical profiles In a first phase (89-91) salinity decreases at intermediate depth both at Otranto Strait and in the Adriatic, indicating a less inflow of LIW (preconditioning). In this phase (not shown) density slowly increases in the Aegean below the sill of the Cretan Arc Only during 1992 and 1993 Ageean water replaces ADW. Note the wrong depth of ADW (‘+’=1989, ‘*’=1990, ‘’=1991, ‘Δ’=1992 and ‘’=1993 Full line without symbols= ‘climatic year’)
Depth in the end section Climatic year 1988 1989 1990 1991 1992 1993 Climatic year 1988 1989 1990 1991 1992 1993 0< z < 200 m Flux (Sv) T S 0.37 16.56 38.75 28.46 0.36 16.76 38.76 28.42 0.56 16.30 38.78 28.56 0.56 16.68 38.78 28.46 0.37 16.89 38.73 28.37 0.81 15.87 38.74 28.62 0.68 16.12 38.77 28.58 Flux (Sv) T S 0.31 (0.14) 13.39 38.63 29.13 0.12 (0.06) 13.35 38.62 29.13 0.002 (0.0006) 13.36 38.62 29.13 0.02 (0.003) 13.35 38.62 29.13 0.02 (0.009) 13.41 38.64 29.13 0.03 (0.01) 13.53 38.69 29.15 0.04 (0.01) 13.48 38.66 29.14 200< z < 600 m Flux (Sv) T S 0.76 14.64 38.88 29.05 0.75 14.69 38.88 29.04 0.90 14.54 38.87 29.06 1.00 14.57 38.87 29.05 0.78 14.63 38.85 29.03 1.01 14.21 38.82 29.10 0.81 14.0 38.80 29.13 600< z < 1200 m Flux (Sv) T S 0.20 14.16 38.81 29.10 0.16 14.18 38.81 29.10 0.41 13.96 38.78 29.12 0.35 14.09 38.80 29.11 0.16 14.17 38.81 29.10 0.53 13.93 38.78 29.13 0.62 13.79 38.78 29.15 1200< z < 1500 m Flux (Sv) T S < 0.01 < 0.01 0.05 13.55 38.69 29.14 < 0.01 < 0.01 0.13 13.68 38.73 29.14 0.23 13.71 38.77 29.16 1500< z < 2000 m Flux (Sv) T S < 0.01 < 0.01 0.02 13.60 38.70 29.14 < 0.01 < 0.01 0.11 13.63 38.72 29.15 0.27 13-70 38.77 29.17 2000< z < 3000 m Flux (Sv) T S < 0.01 < 0.01 < 0.01 < 0.01 < 0.01 0.07 13.61 38.74 29.16 0.33 13.70 38.78 29.18 Antikithera Strait Fully developped EMT Preconditioning phase Otranto Strait
Deep Water: Only particles starting from A1and O1 and reaching ending section L25 deeper than 600 m. and 1500m in less than 4 years are considered. Mean arrival times and second row Green= ‘climatology’ (Clim4) Blu= preconditioning Phase (F4) Red = Fully developped EMT O1 <0.01 <0.01 – 0.01 < 0.01 – 0.05 <0.01 2.8 A1 <0.01 <0.01 – 0.08 < 0.01 – 0.13 0.02 2.8 L25 In the pink boxes are indicated the mean arrival times for particles reaching I37 deeper than 1500 m.
Distribution of arrival times Of particles starting from the western Cretan Arc and reaching ending Sections I37 and L25 S4: 1993 + 3 years forced With climatological forcing
Upwelling from deep layers: particles are released (homogeneously) at 1250, 850 and 620 m. of depth and they are integrated till they reach the depth of 420m 1993:Fully developped EMT standard year From 620 to 420: 0.33 Sv From 620 to 420: 1.30 Sv From 850 to 420: 0.54 Sv From 850 to 420: 0.11 Sv From 1250 to 420: 0.04 Sv From 1250 to 420: 0.21 Sv
Black point: initial conditions in the lower surface Red points: final conditions in the upper surface
‘Climatic year’ 1988 1989 1990 1991 1992 1993 Adriatic (Reg. 1, in Fig 1) 13.10 38.54 29.12 13.61 38.50 28.98 13.49 38.49 29.00 13.74 38.45 28.92 13.40 38.47 29.00 13.06 38.49 29.09 12.75 38.48 29.15 South Aegean (Reg. 2 in Fig1) 14.68 38.89 29.05 14.89 38.89 29.00 14.40 38.87 29.09 14.46 38.87 29.08 14.67 38.87 29.04 14.22 38.86 29.13 13.79 38.83 29.19 Δρ (Aegean –Adriatic) -0.07 0.02 0.09 0.16 0.04 0.04 0.04 Cold winters 1992 and 1993 Table. 1 Mean Hydrological values of the 20 days characterised by having the densest surface water in reg. 1 and reg. 2 of fig.1. Note that the surface water is denser in the Adriatic in the ‘climatic’ year (spin up of the model). The low density values in the Adriatic in the 1990 are due to an anomalous warming in the late winter. Model SST close to satellite SST
Cross isopycnal surface flux F() (T is the time interval of integration, H(x,y,t) and Q(x,y,t) are the heat and freshwater surface fluxes, C p is the specific heat capacity of water, S(x,y,t) and (x,y,t) are the surface salinity and density and and are the derivatives of density with respect to temperature and salinity.) F()([F()]=[Sv]) is the contribution of air-sea fluxes to the mass flux across the isopycnal surface =, normalised on the entire year. The water mass formation induced by air sea interactions in the density range 1 < < 2, is given by the difference between the flux entering 1 an the flux leaving 2, i.e. it is equal to the difference F(2)-F(1).. A water mass body can cross a given isopycnal surface fixed in space or can simply change its density, as a result of air-sea interactions, but remain in place. In this latter case the cross isopycnal flux it is not across any physical surface
Surface cross isopycnal flux - Net decrease of ADW production during 89-91 - Net increase of DW production in all the basin (specially in the EM) during 1992 and 1993 (about 2 Sv). - In these years the Adriatic returns to its typical production rate but the Aegean Sea produce more and denser water Levantine All basin Aegean Adriatic
F(,x,y), geographical distribution of the flow crossing the isopycnal 29.16 During 1993 the shift from Adriatic and Levantine region to Aegean as predominant Source of DW is observed. Same color scale Only heat forcing (relaxation to satellite SST, H=C(T-T*) )
Vertical profiles of salinity difference between 1993 and the ‘climatic’ year The general mechanism of the EMT is reproduced, even with bias in salinity values and ADW depth
Salinity vertical profiles In a first phase (89-91) salinity decreases at intermediate depth both at Otranto Strait and in the Adriatic, indicating a less inflow of LIW (preconditioning). In this phase (not shown) density slowly increases in the Aegean below the sill of the Cretan Arc Only during 1992 and 1993 Ageean water replaces ADW. Note the wrong depth of ADW (‘+’=1989, ‘*’=1990, ‘’=1991, ‘Δ’=1992 and ‘’=1993 Full line without symbols= ‘climatic year’)
Adriatic Sea Strait of Otranto 1 Antikithera Strait O1 Strait of Sicily O2 Kassos Strait 3 Aegean Sea SIC 4 A1 A2 2 A3 A4 I37 L25 Ionian Basin Levantine Basin Cretan Passage Fig. 1
Adriatic Sea Strait of Otranto Antikithera Strait O1 O2 Kassos Strait Aegean Sea A1 A2 A3 A4 Ionian Basin
Climatic year: about 60 000 particles are released at intermediate Depth. Colours indicate depth (blu 200 m, yellow 1700 m.)
Clim4 F4 S4 Total flux [Sv] Lost flux [Sv] ‘Meanders’ [Sv] 1.30 0.92 0.37 1.57 0.42 0.35 2.25 0.60 0.28 A1 O1 Flux [Sv] 0.27 0.14 0.35 A1 A3 Flux [Sv] 0.06 0.35 0.72 A1 SIC Flux [Sv] 0.05 0.66 0.58 Tab.4 First row: Total, lost flux and meanders in the starting section A1. Following rows: Total mean flow connecting the western Cretan Arc to the Otranto Strait, Eastern Cretan Arc and Western Ionian (see Fig.1). No selecting criterion is applied at the ending section.
Clim4 F4 S4 I37 O1 600 < z < 1500 [Sv] z > 1500 [Sv] mean arrival time, z> 1500 [years] 0.33 0.06 2.8 0.10 < 0.01 0.25 0.05 1.1 I37 A1 600 < z < 1500 [Sv] z > 1500 [Sv] mean arrival time, z> 1500 [years] 0.14 < 0.01 -- 0.26 < 0.01 -- 0.42 0.15 0.8 L25 OI 600 < z < 1500 [Sv] z > 1500 [Sv] mean arrival time < 0.01 < 0.01 -- 0.01 < 0.01 -- 0.05 < 0.01 -- L25 A1 600 < z < 1500 [Sv] z > 1500 [Sv] mean arrival time, z> 1500 [years] 0.01 < 0.01 -- 0.08 < 0.01 -- 0.13 0.02 2.8 Tab.6: Deep flow connections between Otranto Strait and Western Cretan Arc (O1 and A1) with a zonal section west of Crete in the Ionian basin (I37) and a meridional section east of the Cretan passage (L25, see Fig. 1). In particular are shown for each experiment the flow relative to particles reaching I37 an L25 with a depth z 600 < z < 1500. For particles that reach the ending section at a depthdeeper than 1500 m. we show both flux and mean arrival time. Mean characteristics are shown only if the flow connection is greater than 0.01 Sv.
Tab.7: Hydrological characteristics and mean depth of particles that starting from the Western Cretan Arc (A1) reach the zonal section west of Crete in the Ionian basin (I37) and the meridional section east of the Cretan passage (L25, see Fig. 1).