Download
1 / 19
190 likes | 643 Views
Wind Power Market Update Harvesting Clean Energy Boise, Idaho February 10, 2003 Larry Flowers Sizes and Applications Small ( 10 kW) Homes (Grid connected) Farms Remote Applications (e.g. battery changing, water pumping, telecom sites, icemaking) Intermediate (1 0-500 kW)

E N D
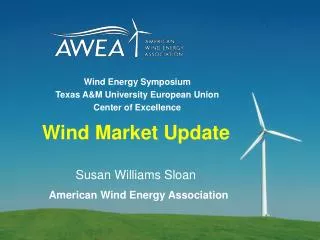
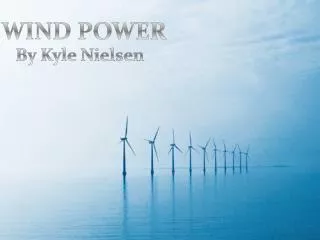
Wind Power Market Update Harvesting Clean Energy Boise, Idaho February 10, 2003 Larry Flowers
Sizes and Applications • Small (10 kW) • Homes (Grid • connected) • Farms • Remote Applications • (e.g. battery changing, water pumping, telecom sites, icemaking) • Intermediate • (10-500 kW) • Village Power • Hybrid Systems • Distributed Power • Large (500 kW – 6 MW) • Central Station Wind Farms • Distributed Power • Offshore Wind Generation • Stations
GE WIND 1.5 MW
Actual Projected Rest of World Rest of World North America North America Europe Europe Growth of Wind Energy Capacity Worldwide Jan 2002 Cumulative MW Rest of World = 2,656 North America = 4,459 Europe = 17,812 MW Installed Sources: BTM Consult Aps, March 2002 Windpower Monthly, January 2002
Wind Economics - Determining Factors • Wind Resource • Financing and Ownership Structure • Taxes and Policy Incentives • Plant Size: equipment, installation and O&M economies of scale • Turbine size, model, and tower height • Green field or site expansion • What is included: land, transmission, ancillary services
Wind Cost of Energy 12 10 8 Low wind speed sites COE (¢/kWh [constant 2000 $]) 6 Bulk Power Competitive Price Band High windspeed sites 4 2 0 1990 2010 2020 1995 2005 2015 2000
COOP vs. IPP Financing • Larger plants are significantly less expensive per kWh • Public power can own/ install smaller plants at comparable cost to large IPP projects • Aggregation of demand reduces costs
Economic Development Opportunities • Land Lease Payments: 2-3% of gross revenue $2500-4000/MW/year • Local property tax revenue: 100 MW brings in on the order of $500-$1,000k/yr • 1-2 jobs/MW during construction • 2-5 permanent O&M jobs per 50-100 MW, • Local construction and service industry: concrete, towers, some electrical usually done locally • Investment as Equity Owners: production tax credit, accelerated depreciation • Manufacturing and Assembly plants expanding in U.S. (Micon in IL, LM Glasfiber in ND)
Key Deployment Issues for Wind Power • Permitting and Siting (visual, noise, avian, land use) • Transmission: capacity allocation, RTO formation, new line builds/planning • Power Variability: impact on utility operations • Evolving competitive markets • Green power markets • Policy environment – PTC, RPS, state tax provisions
Resources: On The Web • AWEA Web site: http://www.awea.org • NWTC Web site: http://www.nrel.gov/wind • National Wind Coordinating Committee: http://www.nationalwind.org • Utility Wind Interest Group site: http://www.uwig.org • WPA Web site: http://www. Windpoweringamerica.gov • Homepower Web Site: http://www.homepower.com • Windustry Project: http://www.windustry.com • Best Links: www.me3.org