Predicting Blood Alcohol Content Decline: A Linear Model Approach
This study examines the metabolism of alcohol, illustrating how blood alcohol content (BAC) rises and then declines linearly after alcohol consumption. Using a linear equation derived from observed data, we can predict when BAC will reach a low level. By setting up the equation and solving for the variable, we project that BAC will drop to 0.002% approximately two hours after reaching a peak of 0.018%. The implications of trendlines and the reliability of predictions based on data strength and outside factors are also discussed.

Predicting Blood Alcohol Content Decline: A Linear Model Approach
E N D
Presentation Transcript
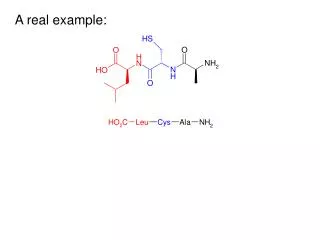
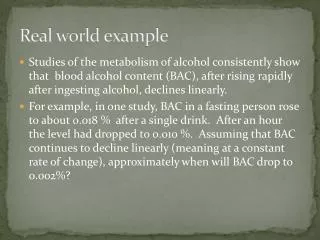
Real world example Studies of the metabolism of alcohol consistently show that blood alcohol content (BAC), after rising rapidly after ingesting alcohol, declines linearly. For example, in one study, BAC in a fasting person rose to about 0.018 % after a single drink. After an hour the level had dropped to 0.010 %. Assuming that BAC continues to decline linearly (meaning at a constant rate of change), approximately when will BAC drop to 0.002%?
Real world example Need to make an equation and then use the equation to answer the question (make a prediction) Define the variables and assign each a letter to represent it We can make it a table for fun
Real world example Make the equation (y intercept) y = -.008x + .018 Make predictions! The question is "when will the BAC reach .002%?“ Plug in .002 for Y and solve for X. .002 = -.008x + .018 -.016 = -.008x x = 2 hours Therefore the BAC will reach .002% after 2 hours.
Trendlines • What if the data isn’t perfectly linear? • Can use trendlines – make predictions • Interpolations / extrapolations
Trendlines • Women’s world records • Trendline - estimate of a linear function that fits the data • Legend – identifies what the dots on the chart represent. For two variable graphs we don’t really need this • Title + axes – always have these labeled • Source
Prediction What is the projected record in 1999? By equation Trendline estimate
How much confidence do you have in your prediction? • Data points – 7 data points is good, lower than this is not as good. • R squared (r2) • This is a measure of strength of the linear relationship between x and y. • .7 to 1 typically indicates a strong linear relationship • .4 - .7 is more moderate linear relationship • < .4 is weak and probably shouldn’t be used to make a prediction
How much confidence do you have in your prediction? • Practical / Physical / Social / Political Sense ?? - Think about your prediction. What outside factors could affect it? - How far away from the data is your prediction? • What will be the record in 2100? • What was the record in 500?