Download
1 / 6
60 likes | 160 Views
Explore changes in cell morphology post-induction with graphical data depicting nuclei characteristics and cell counts at different days.

E N D
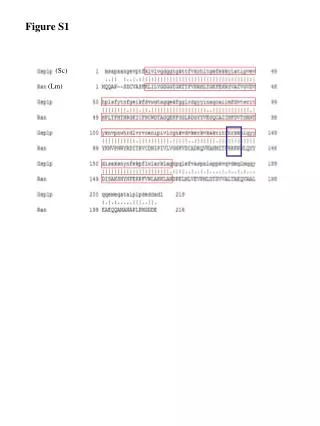
(Sc) (Lm) Figure S1
b. 13 a. 12 Ran-GFPC 11 10 9 Ran cells per mL (log) 8 GPI8 7 1 2 6 5 0 2 4 6 8 10 12 time (day post-induction) c. Control Ran-GFPC Figure S2
Day 1 Day 2 Day 3 NI I day1 I day2 I day3 I day4 Figure S3 A a b c d e B Normal cellular morphology Normal nuclear morphology
Nuclei with fragmented chromatin Normal nuclei Distorted nuclei Figure S3 C
13 13 13 13 12 12 12 12 11 11 11 11 10 10 10 10 NI I NI I cells per mL (log) cells per mL (log) cells per mL (log) 9 9 cells per mL (log) 9 9 NI NI NI NI 8 8 I I 8 8 I I 7 7 7 7 RanGAP RanGAP 6 6 6 6 RCC1d RCC1 (Tb927.7.1190) 5 5 ( Tb927.7.1190 ) 5 5 0 0 1 1 2 2 3 3 4 4 5 5 6 6 7 7 8 8 9 9 10 10 11 11 12 12 0 0 1 1 2 2 3 3 4 4 5 5 6 6 7 7 8 8 9 9 10 10 11 11 12 12 time (day post-induction) time (day post induction) time (day post-induction) time (day post induction) 13 13 14 14 13 13 12 12 12 12 11 11 11 11 10 10 NI I NI I cells per mL (log) 10 10 cells per mL (log) cells per mL (log) 9 9 cells per mL (log) 9 9 NI NI 8 8 NI NI I I 8 8 I I 7 7 7 7 6 6 RCC1b RCC1 RCC1 (Tb927.4.2650) RCC1a ( Tb927.4.2650 ) ( Tb927.7.1210 ) 6 6 (Tb927.7.1210) 5 5 5 5 0 0 1 1 2 2 3 3 4 4 5 5 6 6 7 7 8 8 9 9 10 10 11 11 12 12 0 0 1 1 2 2 3 3 4 4 5 5 6 6 7 7 8 8 9 9 10 10 11 11 12 12 time (day post-induction) time (day post-induction) time (day post induction) time (day post induction) 14 14 13 13 13 13 12 12 12 12 11 11 NI I 11 11 10 10 cells per mL (log) cells per mL (log) 10 10 9 9 NI I cells per mL (log) cells per mL (log) 9 9 8 8 NI NI I I 8 8 7 7 NI NI I I NTF2a NTF2(a) 6 6 7 7 5 5 6 6 RCC1 RCC1c (Tb927.7.6320) ( Tb927.7.6320 ) 0 0 1 1 2 2 3 3 4 4 5 5 6 6 7 7 8 8 9 9 10 10 11 11 12 12 13 13 14 14 15 15 time (day post-induction) 5 5 time (day post induction) 0 0 1 1 2 2 3 3 4 4 5 5 6 6 7 7 8 8 9 9 10 10 11 11 12 12 time (day post-induction) time (day post induction) Figure S4
Cells per mL (log) RCC1a-d B Time (day post-induction) PI Annexin V Figure S5 A I NI


