Understanding Logarithmic Functions and Their Transformations
This guide provides a comprehensive overview of logarithmic functions, their parent equations, and key characteristics such as domain, range, and vertical asymptotes. Learn the step-by-step process for graphing logarithmic functions, including identifying transformations, finding intercepts, and sketching the graph accurately. Master the essential concepts of logarithmic behavior, including reflections, stretches, and shrinks. Ideal for students looking to deepen their understanding of logarithmic functions and enhance their graphing skills.

Understanding Logarithmic Functions and Their Transformations
E N D
Presentation Transcript
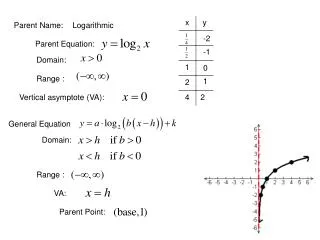
Parent Name: Logarithmic -2 Parent Equation: -1 Domain: 0 Range : 1 Vertical asymptote (VA): 2 General Equation Domain: Range : VA: Parent Point:
Review of Transformations a Reflects across the x-axis Shrinks by a Stretches by a b Reflects across the y-axis h positive h Right h spaces Left h spaces negative h k positive k Up k spaces negative k Down k spaces
Steps for Graphing Logarithmic Functions 1) State the transformations 2) State the Domain and Range. 3) Find the vertical asymptote and then sketch it. 4) Look at your asymptote and think about the domain, will the graph cross the y-axis? If so, find the y-intercept and plot it. If not, there is no y-intercept. 5) Find and plot the x-intercept. (There will always be one.) 6) State the parent point. 7) Put an x on the graph for the parent point and then perform the transformations on this one point. 8) Sketch the graph.
Transformations: Domain: Range: VA: x-int: y-int: P.P.
Transformations: Domain: Range: VA: x-int: y-int: P.P.
Transformations: Domain: Range: VA: x-int: y-int: P.P.
Transformations: Domain: Range: VA: x-int: y-int: P.P.
Transformations: Domain: Range: VA: x-int: y-int: P.P.
Transformations: Domain: Range: VA: x-int: y-int: P.P.