Download
1 / 15
150 likes | 231 Views
Explore how the contribution matrix helps states identify and consult on Class I area pollutants per the regional haze rule. The matrix supports participation in progress goals and targeted consultations as needed.

E N D
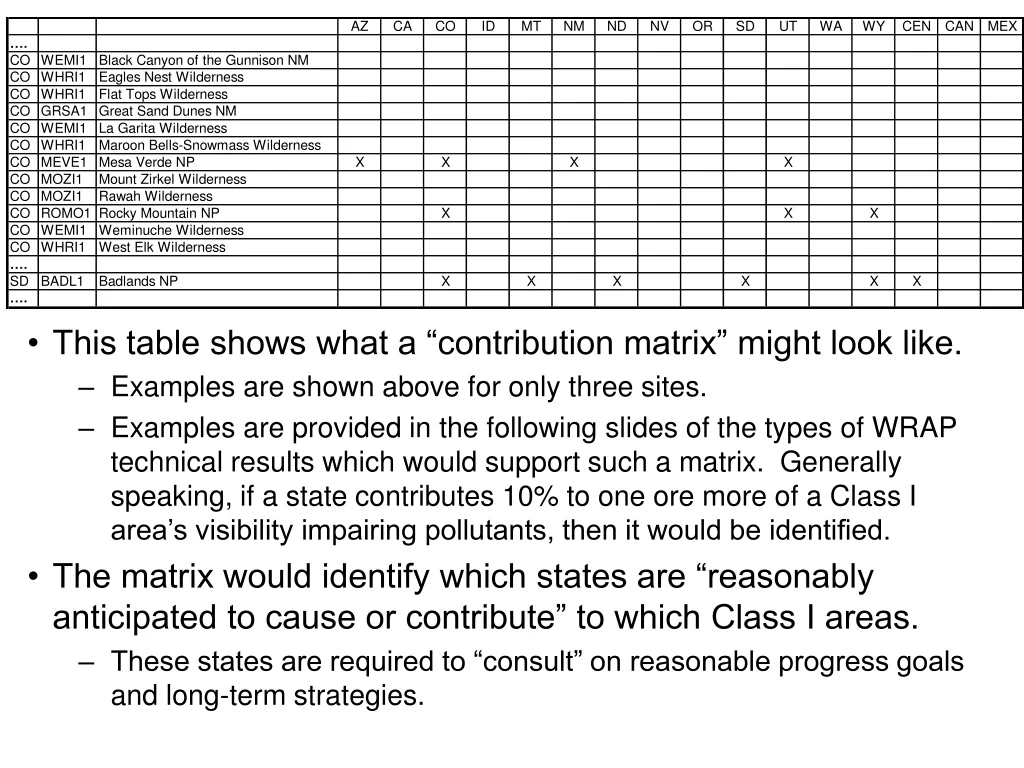
This table shows what a “contribution matrix” might look like. • Examples are shown above for only three sites. • Examples are provided in the following slides of the types of WRAP technical results which would support such a matrix. Generally speaking, if a state contributes 10% to one ore more of a Class I area’s visibility impairing pollutants, then it would be identified. • The matrix would identify which states are “reasonably anticipated to cause or contribute” to which Class I areas. • These states are required to “consult” on reasonable progress goals and long-term strategies.
A state could use this matrix and its supporting technical information: • To justify its participation in a regional process and its acceptance of a regionally-agreed upon set of Class I area reasonable progress goals and strategies, and/or • As a basis for more targeted consultation if and where that may be necessary (e.g., when required by legislators or stakeholders or where visibility progress may be minimal). • As such, the matrix is not a consultation matrix but a contribution matrix, which would support the consultation requirements of each state as it sees fit under the regional haze rule and its individual circumstances.
Upwind Contributing StatesBased on CAMx/PSAT Model Results for SO4 and NO3The following slides use outdatedmodeling results and are presentedfor illustration purposes only.
Rocky Mountain SO4 Modeled Attribution
Rocky Mountain NO3 Modeled Attribution ?
Mesa Verde SO4 Modeled Attribution
Mesa Verde NO3 Modeled Attribution ?
Modeled SO4 Extinction Attributed to WRAP States Contributions from UT, WY, and areas outside the WRAP not included.
Upwind Contributing StatesBased on Back Wind Trajectory Regression Results for SO4
Rocky Mountain SO4 Trajectory Regression ? ?
Mesa Verde SO4 Trajectory Regression
Upwind Contributing StatesBased on Weighted EmissionPotential for Dust and Carbon
2018 Weighted Emission Potential of Coarse Mass Sources at Badlands
2018 Weighted Emission Potential of Primary Organic Carbon Sources at Sawtooth