Download
1 / 26
260 likes | 382 Views
Transportation Modeling in Oregon: Overview of ODOT Statewide Integrated Model. Pacific Northwest Regional Economic Conference Becky Knudson ODOT Transportation Planning Analysis Unit May 11th, 2006. Overview. Intro Description of Statewide Model Model Applications Recap and Questions.

E N D
Transportation Modeling in Oregon:Overview of ODOT Statewide Integrated Model Pacific Northwest Regional Economic Conference Becky Knudson ODOT Transportation Planning Analysis Unit May 11th, 2006
Overview • Intro • Description of Statewide Model • Model Applications • Recap and Questions
Introduction • Transportation modeling in Oregon is a collaborative effort among many jurisdictions and public agencies • 1994 ODOT started the Statewide Model Improvement Program, established a steering committee • Mission to coordinate modeling efforts of state, regional and local agencies, promote development and use of state-of-the-art transportation modeling in Oregon
Introduction cont’d • Program was needed because prevalent modeling methods: • Could not provide information needed to meet state and federal mandates • Or answer questions being asked by the public and policy-makers • Decision-makers needed: • Estimates of effects of policies • Tools to measure performance
Statewide Model: What is it? • Integrated model linking the economy, land use, and transportation elements across state • Statewide model based on production activity - inputs and outputs, and commodity flow • Simulates land use and travel behavior mathematically using several computer programs • Provides a dynamic, price sensitive representation of state economic activity
Statewide Model: How is it Useful? • Provides objective and unbiased comparison between alternative policies • Reveals trade-offs between different policies • Reveals synergies gained by combining policies in different ways • Integrated analysis does not dictate policy, it provides information on how policies will likely play out
Information Produced • Statewide model designed to reveal differences in terms of forecast magnitude and direction • Forecast change in employment, trips, vehicle-miles-of-travel, economic production levels • NOT designed to predict outcomes, forecast values, or prescribe solutions
Using the Statewide Model We Have Learned: • The types of transportation improvements and where they are made affects where jobs and people locate • Different tax structures affect where firms locate and where workers live • The supply of land affects the price of land, in turn affecting where firms and households locate.
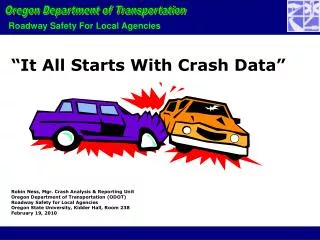
The Problem • Over 500 Oregon bridges identified as cracking 2001 • Nearly 25% of Oregon bridges are beyond their 50 year expected life • Cost to repair or replace bridges $4.7 billion • Statewide Model used to evaluate alternative bridge investment strategies • Final Investment strategy based on • Bridge costs • Economic costs • Community & regional Impacts
Alternative Solutions • No additional bridge investment would lead to • More trucks on road • Higher maintenance & preservation costs • Less future employment growth from higher transport costs • Fix interstate bridges: • Ignores routes connecting to interstate system • Benefits state economy, but harms coastal and central region of state
Best Bridge Strategy • One deficient bridge impedes the entire corridor, ODOT shifted from initial “worst-first” strategy to corridor approach • Improve routes parallel to the interstates to accommodate detoured heavy freight loads • The order in which roads are opened to heavy loads affects regional economy and livability
ODOT Recommendation • $2.5B, initial 10-year strategy to $4.7B bridge problem • Address detour routes before interstate construction • Over 90 percent of the statewide economic benefit of repairing all bridges gained for nearly half the cost
STAGE 1 $92M, 48 bridges
STAGE 2 $657M, 161 bridges
STAGE 3 $567M, 147 bridges
STAGE 4 $234M, 94 bridges
STAGE 5 $116M, 46 bridges
LegislativeDirective: Study New Freeway in Eastern Oregon The model was used to evaluate the potential for a new freeway to divert development and traffic from Western Oregon to Central and Eastern Oregon.
Newberg-Dundee: Highway Bypass Induced Growth Analysis The model was used to examine the potential effects of a bypass on growth of population, jobs and travel. Analysis was part of an Environmental Impact Study for the proposed bypass which resides on a major recreation route and commuter-shed of Portland
Modeling/Analysis Findings • A bypass: • Stimulates economic growth in McMinnville • Supports greater travel for all purposes • Has minimal effects on smaller communities in Yamhill County • Commuter effects vary with a bypass: • Increased commuting by residents in McMinnville vicinity to Portland • Increased share of Newberg area commuters to McMinnville (lower share to Portland)
Recap • Integrated analysis blends the features of land use, transportation and economic activity together to represent the interactions and reveal net effects of change • Statewide model based on production activity, commodity flow, inputs and outputs • Valuable tool for policy makers to evaluate alternative policy choices.
Questions Becky Knudson Senior Transportation Analyst Transportation Planning Analysis Unit 555 13th St NE, Suite 2 Salem, OR. 97301 (503) 986-4113 rebecca.a.knudson@odot.state.or.us