Download
1 / 19
190 likes | 299 Views
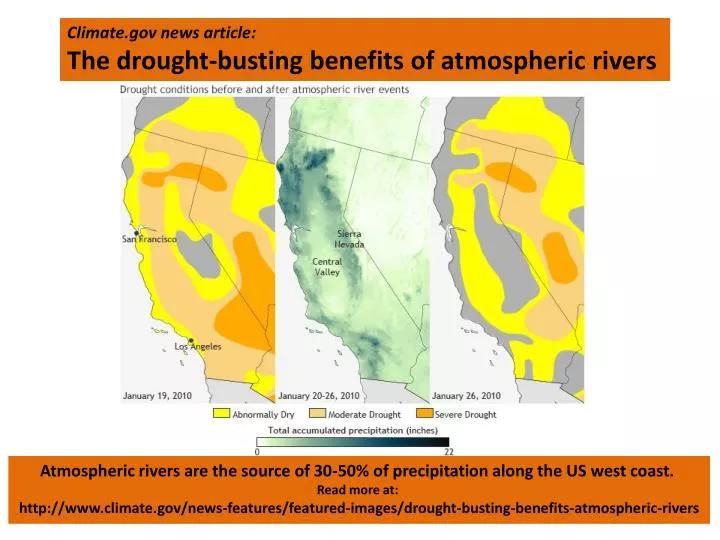
Climate.gov news article: The drought-busting benefits of atmospheric rivers. Atmospheric rivers are the source of 30-50% of precipitation along the US west coast. Read more at: http://www.climate.gov/news-features/featured-images/drought-busting-benefits-atmospheric-rivers.

E N D
Climate.gov news article: The drought-busting benefits of atmospheric rivers Atmospheric rivers are the source of 30-50% of precipitation along the US west coast. Read more at: http://www.climate.gov/news-features/featured-images/drought-busting-benefits-atmospheric-rivers
UC Drought Summit 25 April 2014 Sacramento, CA The summit will bring together a wide range of experts in water sciences, water management and policymaking for thoughtful discussion on how best to manage current and long-term water shortages. More information: https://watershed.ucdavis.edu/project/uc-drought-summit Exceptional Drought: Intensification of drought The 15 April drought monitor continues D4 (exceptional) drought conditions over portions of west central California. A considerable portion of the state remains under D3 (extreme) drought conditions.
The percent of normal precipitation since mid-October 2013 shows most of the west below normal with areas of California and Nevada less than 50% of normal.
The percent of precipitation over the last TWO years shows much of California and Nevada at less than 70% of normal.
Randall Osterhuber at the Central Sierra Snow Laboratory (CSSL) recently updated the above plot showing the snow depth in cm during five of the DRIEST years on record. Note the current dry year (red; 2014) is on par with the previous 5 driest years. CSSL records go back over 110 years.
The Northern Sierra Precipitation 8-station index remains below the amount at this time last year (2012-13). Note last year ended below normal.
From CNAP researcher David Pierce: Observed water year-to-date precipitation percentile Note swath of unusually low precipitation along the entire west coast. This “dot” plot shows station precipitation percentile. Each dot shows a station that has reported data in the last 30 days (data from the GHCN). The values reflect the amount of precipitation that has fallen since October 1, 2013. A value of 50% is normal (a light green dot). Dark brown with a heavy black outline shows unusually low precipitation. http://cirrus.ucsd.edu/~pierce/stainfo/
California reservoirs are well below normal in the central to northern regions of the state. Blue numbers show percent of capacity. Red numbers show percent of historical average.
High pressure has dominated the eastern Pacific since October 2013 October through December 2013 October 2013 through March2014
Northern areas of California/Nevada forecast to get some precipitation from April 21stto 25th
How do the recent northern rainfalls look from a hydrologic point of view? Folsom Lake is a reservoir east of Sacramento Reservoir storage since March of 2009; before recent storms at 170,000 AF (acre-feet) and now at 284,000 AF – a 14% bump up from the storms compared to the desired near-peak storage of 930,000 AF.
How much water is flowing into Folsom Lake? During the storms the inflow reached a maximum near 25,000 CFS (cubic feet per second). The current inflow rate is about 1,800 CFS; before the storms the inflow rate was about 300 CFS. How long would it take to fill Folsom Lake to a desired 930,000 AF level?
CA climate division 5: Just one year makes it above 75% of normal Can we recover from the drought? Chances are slim … To get an idea of the likelihood of recovery from drought status CNAP researcher Mike Dettinger starts with the precipitation deficit from last year (water year 2012-2013). The black squares show what has been observed (added to the deficit) since October (2013; O on the x-axis). The total precipitation is shown on the y-axis and green lines indicate the values as percent of normal.
Can we recover from the drought? Chances are slim … The above histograms summarize the chances of drought recovery for the 7 California climate divisions. Starting with the water deficit from 2012-13 the percent of years that reach normal are tabulated above. The red inverted triangle indicates the historical even odds of where water year 2013-14 may end.
CNAP researcher Mike Dettinger provides us with a look at our ability to reach a normal amount of precipitation this water year. The above map shows the number of years when there was enough rain from January through September to compensate for the lack of rain in the fall. Note western US sites recovered in the fewest number of years.
CNAP researcher Mike Dettinger also provides us with a longer-range look at our ability to reach a normal amount of precipitation considering last water year was also dry. The above map shows the number of years when there was enough rain from January through September to compensate for the lack of rain from the previous fall. Note western US sites, especially in California, rarely recovered.