Download
1 / 35
350 likes | 366 Views
Explore the challenges of climate change in Seoul and the city's strategy for a climate positive transportation system. Learn about key practices and future plans to achieve a low carbon society.

E N D
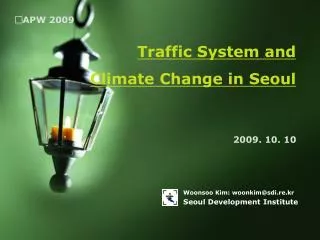
□APW 2009 Traffic System and Climate Change in Seoul 2009. 10. 10 Woonsoo Kim: woonkim@sdi.re.kr Seoul Development Institute
Contents 1. Overview 2. Climate Change in Seoul 3. Challenge of Climate Change 4. Climate Positive Transportation Planning 5. Key Practices & Future Plan
Overview • The Way to the 21st Low Carbon Society(LCS) • A fiercer Green Race is going on: • - responding Climate Change Issues • achieving Promised Green Growth • The Value of both National and City Brand • determined by the concept of LCS • Focus on the Carbon Diet Strategies • Principles of ‘Choice & Concentration’ Strategy • Adoption of ‘Integrated Planning Approach’ APF 2009 : Traffic System and Climate Change in Seoul
Overview • Seoul City’s Strategy for LCS in 2030 • Building Vision House: • diagnosis & Prescription to figure out • ‘why, what is necessary‘ and ‘How to do’ • Preparing ‘Low Carbon Green Growth Plan in 2030’ building energy Group D Sustainable development transportation • Transition to Climate Positive City: recycling • - via ‘Choice & Concentration’ Principles • focusing on optimal combination of ‘Energy • Saving and Efficiency’ with Clean Fuel Supply Water circulation Green Life Style Green space APF 2009 : Traffic System and Climate Change in Seoul
Climate Change in Seoul • Urban Climate Change (Temperature) 2005 Yearly average Diff. 1908 Yearly average (℃) 12.5 0.02 ▲2.1 10.4 Summer (℃) 24.4 0.01 ▲1.1 23.3 Winter (℃) -0.3 0.03 ▲3.2 -3.5 • Increase of Average • Temp.(℃) faster than global • warming by triple times • Global Warming • + Urban heat islands • Remarkable Increase of • Lower Temp. Average Temp.(℃) < Trend of Average Temp.(℃)> APF 2009 : Traffic System and Climate Change in Seoul
Climate Change in Seoul • Urban Climate Change (Seasonal Period) • Days of Winter are shorted by 27days(1920s vs 1990s) • Days of both Spring and Summer are extended 1920s Winter Spring Summer Autumn Winter 1990s Winter Spring Summer Autumn Winter JAN MAR JUN SEP DEC ※ Assumption : Daily Average Temp.(℃) in Winter<5℃, Summer>20℃ APF 2009 : Traffic System and Climate Change in Seoul
Challenge of Climate Change • Rethinking of Built Environment • Expansion Path of Urbanization • Beyond the Optimal City Size • Environmental Carrying Capacity (?) • Indicators • Urban Air Quality • Traffic Congestion • Climate/Energy Citizen Meta- bolism Environment Facility APF 2009 : Traffic System and Climate Change in Seoul
Challenge of Climate Change • Yearly Energy Consumption Trend(Korea, Seoul) 21 180 Korea 19 170 17 160 15 150 Seoul 13 140 11 130 (unit : M toe) 9 120 7 110 5 100 1996 1997 1998 1999 2000 2001 2002 2003 2004 2005 2006 2007 20 Down sloping from 13.4%(1996) to 8.8%(2007) Ratio of Seoul in Korea (%) 16 12 8 4 0 2006 1996 1997 2003 2004 1999 2000 1998 2001 2002 2005 2007 APF 2009 : Traffic System and Climate Change in Seoul
Challenge of Climate Change (unit : thousand toe) LPG 10% Petroleum 41% LPG 31% electricity 18% Other 3% Petroleum 56% coal 13% electricity 23% Coal 1% < Korea> < Seoul> • Energy Consumption By Source (2007) Petroleum LPG electricity coal Total others 100,622 18,955 24,249 31,700 181,455 5,929 Korea 144 6,647 4,951 3,696 16,008 571 Seoul other4% APF 2009 : Traffic System and Climate Change in Seoul
Public · Others5% Public · Others 2% Challenge of Climate Change Industry 10% Building 20% Building 55% Industry 58% Transportation 20% Transportation 30% • Energy Consumption By Sector (2007) (unit : thousand toe) Transpor tation Public · Others Industry Building Total Korea 37,068 4,144 104,327 35,916 181,455 Seoul 4,870 758 1,551 8,829 16,008 < Korea> < Seoul> APF 2009 : Traffic System and Climate Change in Seoul
Challenge of Climate Change 2000 2007 2020 Building 50.1% (8,241) 55.2% (8,829) 53.8% (10,719) Transportation 32.5% (6,480) 34.9% (5,734) 30.4% (4,870) Industry 9.7% (1,551) 8.7% (1,744) 10.9% (1,791) Public · Others 4.2% (684) 4.7% (758) 5.0% (999) Total (thousand toe) 16,450 16,008 19,942 toe/person 1.63 1.50 2.02 • Forecast of Energy Demand APF 2009 : Traffic System and Climate Change in Seoul
Challenge of Climate Change • Trend of CO2 Emissions(Korea, Seoul) 1990 1995 2000 2004 2005 (unit : MT of CO2) 273.7 430.7 490.4 558.8 558.2 47.4 52.9 50.2 44.0 43.7 Korea Seoul 17.3% 12.3% 10.2% 7.9% 7.8% APF 2009 : Traffic System and Climate Change in Seoul
Challenge of Climate Change • Energy Saving Goal of Seoul • Energy Saving by 15% (2000 vs 2020) • Total Energy Saving by 30% (5.9 M toe) in 2020 • Energy Use (toe/person) downed from 2.02 to 1.41 19,942TOE 30% Saving in 2020 ( BAU base) 16,456TOE 16,008TOE 15% Saving (2000 vs 2020) 14,000TOE 2000 2003 2007 2020 APF 2009 : Traffic System and Climate Change in Seoul
Climate Positive Transportation Planning • Statement of Problem • Transport · Urban Planning • Increase of Total VMT • Excessive Travel Demand • Short-span of Transport and Land-use Plan • Energy Consumption • High Dependency on Energy Consumption • Traffic Congestion APF 2009 : Traffic System and Climate Change in Seoul
Climate Positive Transportation Planning • Car Ownership in Seoul (unit : each) 2009.8 1990 1995 2000 2005 2,379,072 Passenger Car 883,415 1,595,039 1,796,720 2,209,526 187,826 Bus 103,833 70,283 289,219 204,138 372,812 Truck 204,641 311,297 352,801 392,196 3,481 Special Car 1,744 2,011 2,252 2,911 2,943,191 Seoul 1,193,633 2,043,458 2,240,922 2,808,771 17,091,886 Korea 3,394,803 8,468,901 12,059,861 15,396,715 17.2% Seoul/Korea 33.0% 24.1% 20.2% 18.2% APF 2009 : Traffic System and Climate Change in Seoul
Climate Positive Transportation Planning • Issues • Transport’s Contribution on Air Pollution • 76.1%(2003), 75.2%(2004), 74.1%(2005), 74.2%(2006) • Structural Debates in Transport Sector • Car Ownership • VKT • Vehicle-Operating Cost • Fuel Price • Emission Inspection and Maintenance • Economic Incentive • R&D on Cleaner Technology • Integrated Management APF 2009 : Traffic System and Climate Change in Seoul
Climate Positive Transportation Planning Others Bus Subway Automobile Mode Share 26.3% 27.6% 34.7% Energy Ratio 53.2% 16.7% 11.8% 18.3% • Weak Points of Transportation System • : Cost, Energy, Inefficiency • More Energy used Automobile - oriented Transportation • - Mode share (26.3%) • - Energy Ratio (53.2%) • Increasing Pattern of Travel Congestion Cost • - 2005 : $ 0.5 billion • - 2030 : $ 1.2 billion 11.4% APF 2009 : Traffic System and Climate Change in Seoul
Climate Positive Transportation Planning • CO2 Emissions of Types of Vehicles (unit : thousand tonnes of CO2) 2000 2002 2004 2006 Passenger Car 5,796 (55.5%) 6,299 (59.6%) 6,305 (62.1%) 6,027 (63.8%) Bus 2,207 (21.1%) 1,795 (17.2%) 1,587 (15.6%) 1,345 (14.2%) Truck 2,418 (23.1%) 2,322 (22.2%) 2,226 (21.9%) 2,038 (21.6%) Special Car 29 (0.3%) 38 (0.4%) 32 (0.3%) 37 (0.4%) Total 10,450 10,455 10,150 9,447* Note : * The Contribution CO2 emissions from Transportation sector is about 21.0% of total emissions. APF 2009 : Traffic System and Climate Change in Seoul
Climate Positive Transportation Planning Human Scale Transportation Provision of Green Cars • Environment Friendly Strategies and Key Projects Strategies Key Projects CNG Bus Operation CNG Hybrid Bus Travel Mode▶ Provision of clean car, green car Electric Motorcycles Hydrogen Fuel cell Use of Automobile▶ Mass Transit, Walkable Street LPG Hybrid Electric Cars Increasing Use of Green Travel Modes APF 2009 : Traffic System and Climate Change in Seoul
Key Practices & Future Plan • Bus Priority Lane System • 73.5km (8 Axes) : ~2008 year • 130.6km until 2010 year • Integrated Bus Management System(BMS) • Provision of Actual Bus Operation Information at Bus Stop • Flexible Bus Scheduling for citizen’s Convenience • Multi-Service by Smart Card APF 2009 : Traffic System and Climate Change in Seoul
Key Practices & Future Plan • Bicycle Use Plan • Passenger mode share • : 10%(~2020 year) • Bicycle Priority Lane • : 207km(~2012 year) • 2008(31km) → 2010(41km) → 2012(45km) APF 2009 : Traffic System and Climate Change in Seoul
Key Practices & Future Plan • System Design of Bicycle Use Priority • Building public leasing system • Introduction of Bicycle priority signal operation • Connection with High-Tech System such as • T-money, RFID, etc. APF 2009 : Traffic System and Climate Change in Seoul
Key Practices & Future Plan • Provision of Green car • CNG Bus Operation • Substitution of all Diesel Bus to CNG Buses(~2010) • 5,854 CNG Buses (~2009.2) • CNG Gas Station: 21(2006) → 45(2009) • Future Plan • 20% of total Vehicle enrollment ( ~2020) • 50% of total Vehicles enrollment ( ~2050) < Fuel Cell Electric Vehicle > < Hybrid vehicle> < electric vehicle > APF 2009 : Traffic System and Climate Change in Seoul
Key Practices & Future Plan • Preliminary Introduction of Electric Bus • Operating of Electric Bus on Mt.Namsan’s Ring Road (2010.3) • - MOU between Seoul city and Corporations • Technical Experiment of Peanut-shaped Bus Operation(2009.7) • Choice of optimal short-distance Routes of Electric Bus <Peanut-shaped Electric Bus> APF 2009 : Traffic System and Climate Change in Seoul
Key Practices & Future Plan • Yearly Promotion Plan • Conversion of public vehicles to EV • Public Electric Charging Infrastructure 1,500 accumulated vehicles accumulated sites 7,000 1,200 4,000 900 2,000 1,000 600 300 300 50 100 201020122014201620182020 201020122014201620182020 201020122014201620182020 201020122014201620182020 • Electric(HEV, EV)Taxi • Electric(HEV, EV)Bus 7,000 70,000 accumulated vehicles accumulated vehicles 4,000 50,000 2,000 30,000 1,000 10,000 500 200 40 5 ] APF 2009 : Traffic System and Climate Change in Seoul
Key Practices & Future Plan • Social Benefits of EV Operation • Assumption : 10% of total VKT in 2020 is made by EVs Energy Saving • $ 800 million/year Reduction Of CO2 Emissions • One MT of CO2/year • Certified CDM Projects Reduction of Air pollutants • 30 thousand tonnes • Social Cost ($0.2 billion/year) APF 2009 : Traffic System and Climate Change in Seoul
Key Practices & Future Plan • Application of OLEV priority Lane • Technical Development and Experimental Operation (2009.7.14) • - Operation Lane: Electric Supply and Charging under Operation • - Common Use of Road with Vehicles via underground Cable of Power Supply <KAIST OLEV> • Extensive Application of OLEV Priority Lanes • - Area-wide & Bus priority Lane Concept of OLEV Minimizing capacity by1/5 Battery Electric Collecting Equipment Power Supply Rail Cheap Road Supply of Power Efficient power collecting from bottom of bus Inverter APF 2009 : Traffic System and Climate Change in Seoul
Key Practices & Future Plan After • Environmental Zone • Emission Reduction Effects • Target : attachment of DPF to Diesel Vehicle (7 year after model year) • Enforcement : 2010~ before APF 2009 : Traffic System and Climate Change in Seoul
Key Practices & Future Plan • Introduction of Tram (Light Rail Transit) • Travel within CBD (Short-term) • + Transfer between Sub CBD (Long–term) • Experimental Operation • : 1st stage • Common Use of Road with Vehicles • to minimize traffic Congestion • One-way Circulating Tram Operation APF 2009 : Traffic System and Climate Change in Seoul
Key Practices & Future Plan • Operation of “Carbon Zero District”(CZD) • Selection of Target Sites • Where Traffic flows are concentrated, • but flat area favorable to operation of • EVs • Prohibiting entry to CZD except Vehicles including Green Car, Tram, OLEV, Bicycles APF 2009 : Traffic System and Climate Change in Seoul
Thank you for Attention woonkim@sdi.re.kr
Sustainable Transportation in Seoul • Emission Reduction Strategies APF 2009 : Traffic System and Climate Change in Seoul
Sustainable Transportation in Seoul • Emission Reduction Strategies APF 2009 : Traffic System and Climate Change in Seoul
Sustainable Transportation in Seoul • Emission Reduction Strategies APF 2009 : Traffic System and Climate Change in Seoul
Sustainable Transportation in Seoul • Emission Reduction Strategies APF 2009 : Traffic System and Climate Change in Seoul