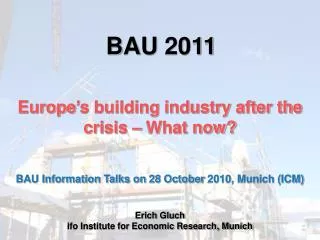
BAU 2011
BAU 2011. Europe’s building industry after the crisis – What now?. BAU Information Talks on 28 October 2010, Munich (ICM). Erich Gluch ifo Institute for Economic Research, Munich. Building volumes in Europe 1991 to 2012. in 2009 prices. € bn. Average growth 1991 - 2007: 1.36% p.a.

BAU 2011
E N D
Presentation Transcript
BAU 2011 Europe’s building industry after the crisis – What now? BAU Information Talks on 28 October 2010, Munich (ICM) Erich Gluch ifo Institute for Economic Research, Munich
Building volumes in Europe 1991 to 2012 in 2009 prices € bn Average growth 1991 - 2007: 1.36% p.a. 2007 - 2010: -15.2% 2010 almost back to the same level as 1998 Source: Euroconstruct.
Residential construction volumes in western Europe 1991 to 2012 in 2009 prices € bn Average growth 1991 - 2007: 1.90% p.a. 2007 - 2010: -22.2% 2010 below the level of 1994 Source: Euroconstruct.
Country 2012 / 2010 2012 / 2007 Ireland -5.8 -59.0 dramatic slump Spain -4.8 -53.0 Portugal -2.3 -24.7 Denmark 10.4 -9.6 Italy 6.4 -11.4 Great Britain 3.4 -9.8 strong decline France 1.7 -11.1 Finland 2.5 -9.4 Hungary 12.6 1.8 Czech Rep. 5.3 -3.1 Netherlands 1.3 -6.2 Norway 6.4 -1.3 slight downturn Austria 0.8 -4.6 Belgium 3.9 0.2 Sweden 11.5 8.6 Slovak Republic 15.9 17.3 Switzerland 2.4 4.7 (moderate) rise Germany 1.8 4.2 Poland 30.7 67.1 Residential construction volumes in Europe acc. country 2008 to 2012 Change in % Change in % 2010 / 2007 -56.5 -50.6 -22.9 -18.1 -16.8 -12.8 -12.5 -11.6 -9.6 -7.9 -7.4 -7.3 -5.4 -3.6 -2.6 1.3 2.2 2.3 27.8 Source: Euroconstruct.
Home completions in Spain and Germany 1991 to 2012 1 000 homes Spain Germany Source: Euroconstruct.
Building activity in Poland 1991 to 2012acc. segment in 2009 prices € bn Civil engineering Non-residential construction Residential construction Source: Euroconstruct.
Building volumes in Europe 2009 acc. country in 2009 prices 4 eastern European countries6% Germany 19% 10 other western European countries 25% France 15% € 1.316 bn 14% 10% 11% Italy Spain Great Britain Source: Euroconstruct.
2008 2012 Residential construction acc. country 2008 and 2012 in 2009 prices Mrd. € Source: Euroconstruct.
2008 2012 Non-residential construction acc. country 2008 and 2012 in 2009 prices € bn Source: Euroconstruct.
Investment in construction in Germany 2000 to 2012 Change over previous year in % Residential construction Non-residential construction Building construction Source: Federal Statistical Office, ifo Institut.
Non-residential construction, R&M Residential construction, R&M Non-residential construction, new-build Residential construction, new-build New-build and R&M in European construction 1992 to 2012 Change over previous year in % Source: Euroconstruct.
New-build and R&M in European construction 1992 and 2012 Change over previous year in % 1992 2012 Residential construction,new-build Residential construction,R&M 28% 28% 23% 36% 21% 25% 19% 20% Non-residential construction,new-build Non-residential construction,R&M Source: Euroconstruct.
Many thanks for your attention Remember: BAU 2011 … … starts in Munich … in just 80 days !