Download
1 / 3
30 likes | 104 Views
Explore the evolutionary rate differences between annuals and perennials using nuclear and chloroplast genes. Scattered plots showcase comparisons and regression lines.

E N D
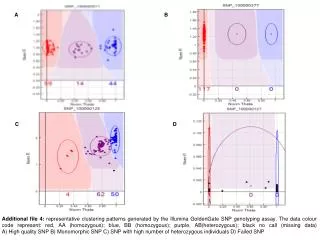
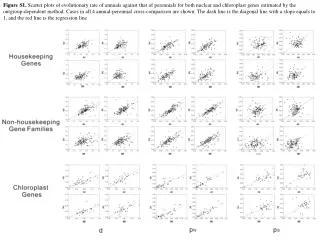
Figure S1. Scatter plots of evolutionary rate of annuals against that of perennials for both nuclear and chloroplast genes estimated by the outgroup-dependent method. Cases in all 4 annual-perennial cross-comparison are shown. The dash line is the diagonal line with a slope equals to 1, and the red line is the regression line
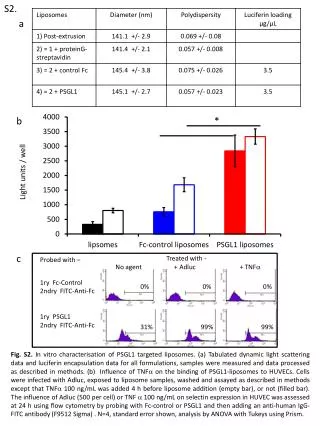
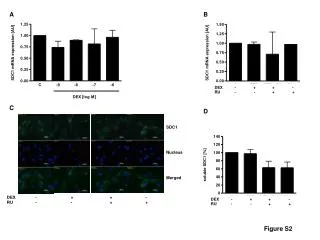
Figure S2. Scatter plots of evolutionary rates of annuals against that of perennials for all 3 sub-datasets of non-housekeeping gene families estimated by the outgroup-dependent method. Cases in all 4 annual-perennial cross-comparison are shown. The dash line is the diagonal line with a slope equals to 1, and the red line is the regression line
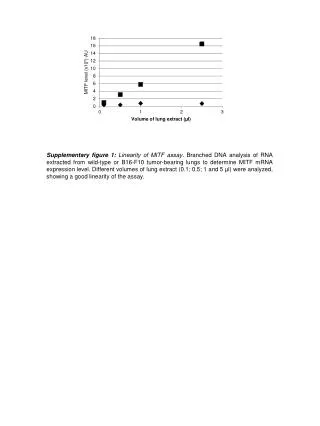
Figure S3. Scatter plots of evolutionary rate in annuals against that in perennials for the 3 sub-datasets collected from non-housekeeping gene families estimated by the ML method. Cases in all 4 annual-perennial cross-comparisons are shown. The dash line is the diagonal line with a slope equals to 1, and the red line is the regression line