
Sample Size Calculation for Comparing Strategies in Two-Stage Randomizations with Censored Data
This paper discusses sample size calculation and test statistics for comparing treatment strategies in two-stage randomized clinical trials, focusing on scenarios where the time to event is censored. It leverages the asymptotic distribution of test statistics under a local alternative hypothesis, particularly in areas like cancer and mental health research. The methodology emphasizes the importance of estimating variance based on prior knowledge to achieve necessary power for testing the equivalence of strategies, and uses weighted estimators for improved accuracy.

Sample Size Calculation for Comparing Strategies in Two-Stage Randomizations with Censored Data
E N D
Presentation Transcript
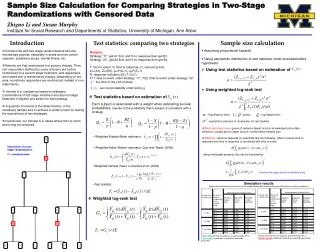
Sample Size Calculation for Comparing Strategies in Two-Stage Randomizations with Censored Data Zhiguo Li and Susan Murphy Institute for Social Research and Departments of Statistics, University of Michigan, Ann Arbor Introduction Sample size calculation Test statistics: comparing two strategies • Assuming proportional hazards • Using asymptotic distribution of test statistics under local alternative hypothesis • Clinical trials with two-stage randomizations become increasingly popular, especially in areas such as cancer research, substance abuse, mental illness, etc. • Patients are first randomized to a primary therapy. Then non-responders (defined by some criterion) are further randomized to a second stage treatment, and responders are treated with a maintenance therapy (depending on the area, sometimes responders are randomized instead of non-responders). • Interest is in comparing treatment strategies (combinations of first stage treatment and second stage treatment if eligible) and select the best strategy. • A question of interest is the determination of the necessary sample size to achieve a certain power for testing the equivalence of two strategies. • In particular, our interest is in cases where time to some event may be censored. Notation: Strategy “11”: get A1 first, and if no response then get B1. Strategy “22”: get A2 first, and if no response then get B2. T: time to event, S: time to response, C: censoring time X=I(A1), Z=I(B1), p=P(X=1), q=P(Z=1) R: response indicator=I(S<T, S<C) T11: time to event under strategy “11”, T22: time to event under strategy “22” : the time of the end of study : survival probability under policy jj • Using test statistics based on estimation of • Using weighted log-rank test • Test statistics based on estimation of Each subject is associated with a weight when estimating survival probabilities: inverse of the probability that a subject is consistent with a strategy : Significance level, : power, : log hazard ratio : asymptotic variance of (numerator of) test statistic • Most important issue: guess of variance based on prior knowledge before data collection: usually get an upper bound—conservative sample size • Difficulty: variance depends on quantities like the following, which involves time to response and time to response is correlated with time to event • Weighted Kaplan-Meier estimator: • Weighted Aalen-Nelson estimator: Guo and Tsiatis (2006): • Weighted sample mean: Lunceford et al. (2002) • Test statistic: Illustration of a two-stage randomization R = randomization Using martingale property, this can be bounded by Guess at the upper bound is relatively easy Simulation results Sample sizes calculated from the test based on the weighted Kaplan-Meier estimator and power of different tests under this sample size • Weighted log-rank test Failure time and time to response are generated from a Clayton copula model with a positive association parameter Failure time and time to response are generated from a Frank copula model with a negative association parameter


