
新安学校 叶范你
新安学校 叶范你. 13. (单位:个). 12. 11. 10. 9. 8. 7. 6. 5. 4. 3. 2. 1. 0. 我们小组爱吃的水果统计图. 引入铺垫. 从图中你发现 1 格表示几吗 ?. 1000. 800. 600. 二厂. 400. 一厂. 200. 技术 人员. 管理 人员. 勤务 人员. 0. 工人. 东方印刷厂各类人员人数 复式条形统计图. 200 8 年 5 月制. XX 市中小学生参观科技展人数统计表. ( 1998~2003 年). XX 市中小学生参观科技展人数统计图.

新安学校 叶范你
E N D
Presentation Transcript
13 (单位:个) 12 11 10 9 8 7 6 5 4 3 2 1 0 我们小组爱吃的水果统计图 引入铺垫 从图中你发现1格表示几吗?
1000 800 600 二厂 400 一厂 200 技术 人员 管理 人员 勤务 人员 0 工人 东方印刷厂各类人员人数 复式条形统计图 2008年5月制
XX市中小学生参观科技展人数统计表 (1998~2003年)
XX市中小学生参观科技展人数统计图 单位:万人 (1998~2003年) 11 10 10 9 8 8 8 7 6 6 5 4 4 3 3 2 1 0 年份/年 1998 1999 2000 2001 2002 2003 你 能 获 得 哪 些 信 息?
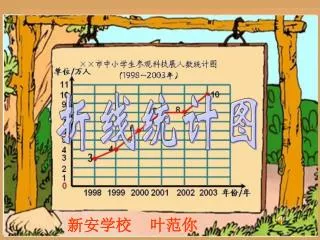
XX市中小学生参观科技展人数统计图 折 线 统 计 图 单位:万人 (1998~2003年) 11 10 10 9 8 8 8 7 6 6 连线 5 4 4 3 描点 3 2 1 0 1998 1999 2000 2001 2002 2003 年份/年
XX市中小学生参观科技展人数统计图 单位:万人 (1998~2003年) 11 10 9 8 7 6 5 4 3 2 1 0 1998 1999 2000 2001 2002 2003 年份/年 XX市中小学生参观科技展人数统计表 (1998~2003年)
不同点:条 形 统 计 图 是 用 直 条 的长 短 表 示 数 量 的 多 少 ,而 折 线 统计 图 是 用 描 点 连 线 的 方 法 表示 数量 的 多 少 及 数 量 的 增 减 变 化 情 况的。 相同点:都 是 用 一 个 单 位 长 度 表示 一 定 的 数 量 。( 如 例 1 中 一 个单位 长 度 表 示 1 万 人 )
1.你发现折线统计图有什么特点? 答:它不仅可以表示出数量的多少,还能够以折线的起伏,清楚的表示出数量的增减变化情况。 2.(1)中小学生参观科技展的人数有什么变化?(2)你有什么感想? 答:(1)中小学生参观科技展的人数(从1998年—2003年)呈逐年递增趋势。
归纳总结 通过今天这节课你有什么收获?与大家交流交流