
High-Resolution Lightning Forecasts Using Dynamic WRF Methods
This study presents a novel approach for short-range lightning forecasting using high-resolution Weather Research and Forecasting (WRF) model data. The dynamic lightning forecast method leverages the production rate of electrical energy in clouds, incorporating factors such as vertical velocity and water mixing ratios. Verification statistics show promising results, with high threat scores and low false alarm rates, indicating improved accuracy compared to traditional methods. Real-time lightning and weather forecasts are accessible online, providing critical information for severe weather prediction.

High-Resolution Lightning Forecasts Using Dynamic WRF Methods
E N D
Presentation Transcript
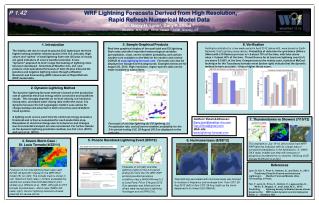
3. Sample Graphical Products P 1.42 WRF Lightning Forecasts Derived from High Resolution, Rapid Refresh Numerical Model Data Dr. Barry H. Lynn1, Gary P. Ellrod2 1 Weather-It-Is, Ltd., Efrat, Israel 2 CCM, Granby, CT • Introduction 8. Verification Verification statistics for a two-week period in April 2012 (below left), were based on Earth-Networks Total Lightning observations. Probability of detection for grid boxes (36km x 36km) with >10 flashes per hour is >.6 about 70% of the time, with false alarm rates <.3 about 40% of the time. Threat Scores for at least one lightning event (>1) are above 0.5 80% of the time. Comparisons to the widely-used, statistical McCaul technique for the Tuscaloosa tornado event (below right) indicate that the dynamic method is more accurate – it has a higher threat score. Real-time graphical display of forecast total and CG lightning flash rates and other important meteorological variables (precipitation, snow, severe weather probability, and surface weather) are available on the Web for the eastern and central CONUS at www.lightning-forecast.com. Forecasts can also be displayed on Google Earth backgrounds. Examples below are for August 20, 2012. High resolution, region-specific data can be made available to subscribers. The fatality rate due to cloud-to-ground (CG) lightning is the third highest among weather-related causes in the U.S. annually. High values and “spikes” of total lightning flash rate (CG plus in-cloud) are good indicators of severe weather potential. A new “dynamic” approach to short range forecasting of lightning rates has been developed. Scientists at Weather-It-Is, Ltd. now produce 4 km operational forecasts of total (IC plus CG) and CG (positive and negative lightning rates) through a Weather Research and Forecasting (WRF) downscale of Rapid Refresh (RAP) model data. 2. Dynamic Lightning Method The dynamic lightning forecast method is based on the production rate of potential electrical energy within convective and stratiform clouds. This strongly depends on vertical velocity, ice fractional mixing ratio, and liquid water mixing ratio within the cloud. It is dynamic because the 4-D Lagrangian model it uses allows for charge buildup and advection in both convective and stratiform cloud systems. A lighting event occurs each time the electrical energy exceeds a threshold and is then accumulated for each model time step. Dissipation of electrical charge due to turbulence and changes due to horizontal transport are also considered. For further details on the dynamic lightning prediction method, see Yair et al. (2010) and Lynn et al. (2012). Authors’ Email Addresses: Barry.lynn@weather-it-is.com Gary.Ellrod@gmail.com Web site: www.lightning-forecast.com 7. Thunderstorms vs Showers (7/15/12) Forecasts of (a) total lightning (b) CG lightning, (c) Precipitation rate, and (d) severe weather probability for the 3-hr period ending 21Z, 20 August 2012 as displayed on the web site. 6. Hurricane Isaac (8/28/12) 4. Severe Storm Case : St. Louis Tornado (4/22/11) 5. Pocono Racetrack Lightning Event (8/5/12) This example on July 15-16, 2012 shows how WRF-RAP lightning forecasts (left) for a large area of convective precipitation in the Northeast U. S. (NWS OKX radar, middle) can help with forecasts of dangerous thunderstorms vs showers. Verifying (03Z) Vaisala NLDN plot is at right. References Forecasts of CG (left) and total lightning (right) for the 3-hr period ending 21z from the 15z WRF-RAP portend possible hazardous conditions near a NASCAR event (*) at Long Pond, PA on 5 August 2012. One spectator was killed and nine others were injured due to lightning that began around 5PM (21z).. Lynn, B, Yair Y., Price C., Kelman, G., and Clark, A., 2012: Predicting Cloud-to-Ground and Intracloud Lightning in Weather Forecast Models. Wea. Forecasting, in Press. Yair, Y., Lynn, B., Price, C., Kotroni, V., Lagouvardos, K., Morin, E., Mugnai, A., and Llasat, M. C., 2010: Predicting lightning density in Mediterranean storms based on the WRF model dynamic and microphysical fields. J. Geophys. Res. Forecast 10-min total lightning flash rates valid 0015Z, 22 April 2011 based on the WRF-RUC model 18z run (left). The tornado track is shown in red. Maximum flash rates (>70 fpm) exceeded the severe/non-severe threshold described in prior studies (e.g. Williams et al. 1999). Although an EF4 tornado touched down ~45min later (NWS LSX radar, right), the 6-hr lightning forecasts showed potential for severe storms. Total lightning associated with Hurricane Isaac was forecast to increase in frequency and coverage from 11am CDT, 28 Aug 2012 (left) to 2am CDT, 29 Aug (right) as the storm deepened to its lowest SLP (968mb).


