Download
1 / 8
80 likes | 180 Views
Discover how to determine college football rankings using clustering analysis. Learn to collect statistics, parse data, cluster, and predict rankings using MATLAB. Real data from 2004 included.

E N D
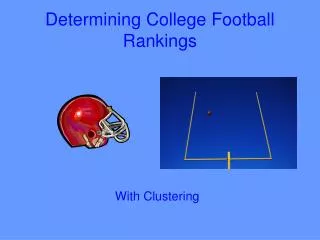
Determining College Football Rankings With Clustering
Where do we start? • Look for statistics on the web • This keeps data up to date – smoother updates. • Determine good statistic set • Don’t want too many so that data is redundant • Don’t want too few – Not enough data for good approximation • Download Data
I Don’t Think Were In Kansas Anymore Now that we’ve got data what should we do? • Parse it! • Create PERL scripts to transform meaningless .html into nice numbers • Put these numbers in files so that MATLAB can use it
And Now Cluster Away! • Cluster each data set. Award weights to closest points next to each. • Use 10 clusters for each data set.
Reorganize the Data • Group the Data according to its team • Make it a nice file so MATLAB can perform a function on it.
Make a function from the data • Use one year’s stats and complete rankings as a training set. • Use the next year as the test set. Note: Real function is linear, not squared.
Finally! • Sort the data, according to the output of the function. • And your winner is……
You, because you are finished! Here’s the real data for all you nay-sayers (2004): • #1. Southern California - 167.3486 • #2. Auburn - 161.4341 • #3. Oklahoma - 116.2092 • #4. Texas - 112.4908 • #5. Miami (Fla.) - 112.4448 • #6. Virginia Tech - 111.4653 • #7. California - 108.7134 • #8. Florida St. - 108.4097 • #9. Utah - 107.8165 • #10. Louisville - 107.5966 • #11. Iowa - 107.5766 • #12. Boise St. - 104.7642 • #13. Georgia - 100.8888 • #14. Bowling Green - 95.4476 • #15. Purdue - 91.1031 • #16. Virginia - 88.6308 • #17. Arizona St. - 88.2669 • #18. Texas A&M - 86.3354 • #19. Wisconsin - 83.4357 • #20. Navy - 83.3217 • #21. Fla. Atlantic - 83.0395 • #22. Ohio St. - 80.6131 • #23. Tennessee - 79.4607 • #24. UTEP - 79.2717 • #25. Texas Tech - 79.0969 • Matched 20 of 25 top 25 teams • Exactly matched top 4 teams