Download
1 / 20
200 likes | 306 Views
Functional Site Prediction Selects Correct Protein Models. Vijayalakshmi Chelliah vchelli@nimr.mrc.ac.uk Division of Mathematical Biology National Institute for Medical Research Mill Hill, London. Sixth International Conference on Bioinformatics InCoB2007 HKUST, Hong Kong

E N D
Functional Site Prediction Selects Correct Protein Models Vijayalakshmi Chelliah vchelli@nimr.mrc.ac.uk Division of Mathematical Biology National Institute for Medical Research Mill Hill, London Sixth International Conference on Bioinformatics InCoB2007HKUST, Hong Kong 27th – 30th August 2007
Functional site prediction - applications: • To predict function of the protein (Pazos & sternberg, 2004; PNAS 101:14754-9) • In protein – protein docking: To select the near-native docked solution. (Chelliah et al., 2006; JMB 357:1669-82). • In sequence-structure homology recognition and to improve alignment accuracy (chelliah et al., 2005; Proteins 61:722-31)
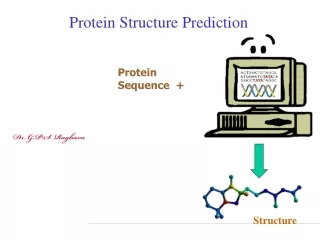
Gene sequence Protein sequence Predict structure: De-novo/ab-initio Xray/NMR Protein structure Protein structure select correct models Functional site prediction
Overview • De-novo protein structure prediction method (decoy generation) • Functional site prediction method • Evaluating models • Conclusions
De-novo protein structure prediction method SEQUENCE ALIGNMENT IDEAL FORMS Predicted Res. burial Predicted sec. structure Fold Generation and scoring *Taylor (2002). Nature. 416:657-660 Secondary structure ‘stick’ level Top 1/3 C models Threading Top 100+N Residue level Refinement STRUCTURE PATTERNS Top 100+N Main-chain level Top 200 models
Functional site prediction method • Biochemically important residues are typically found in close proximity and are also highly conserved. • Functional site prediction is done using CRESCENDO* (gives scores for each residue position). • *Chelliah, V., L. Chen, et al. (2004). J Mol Biol 342(5): 1487-504.
CRESCENDO: Functional site prediction method * Environment specific substitution table Alignment position 1 2 3 4 5 6……………….. (sp1+sp2+sp3+sp+…+spN)/N = Expected substitution pattern for each amino acid (q) at tth position sp1 sp2 sp3 sp4 sp- sp- spN Multiple sequence alignment of the homologous sequences: structure based sequence alignment Observed substitution pattern for each amino acid (p) at tth position Divergent score between the observed (p) and expected (q) substitution table • *Overington et al., (1992). Protein Science 1:216-26
Assumptions • Correct or near-native like models will have the critical residues important for binding (identified by CRESCENDO) to be in close proximity to each other. i.e. Functional residues in the correct models form clusters Functional residues in the incorrect models might be scattered. • Can correct and incorrect models be distinguished by looking at how the functional residues are packed in the models?
Clustering of models 200 decoy models Classify based on fold types F1 F2 F3 F4 Fn ---- SAP * Cluster: rmsd- ≤2 Å & PID ≥60% cut-off ---- Average C coordinate of models of each cluster is used to find the pair-wise distance between residues. *Taylor (1999). Prot. Sci. 8:654-665.
Model score • Pair-wise distance and product of CRESCENDO scores between each pair of residues (that are at least 8 residues apart in the linear sequence) are calculated. • The number (in %) of pair of residues that are within the spatial distance of 12 Å, in the top 40 pairs (based on product of CRESCENDO scores) was calculated. • The percentage scores were added in each step (in steps of 5 pairs) to get the final score of the models.
Good and poor models of same fold type 2trxA- 34 clusters (with ≤ 2Å rmsd and ≥ 60% PID) were obtained from 81 correct models Why clustering between models of same type needed? Function site prediction differs between models of same type due to a) difference in loop conformation, b) beta strand or helix shift even by a single residues. So, even correct folds might have poor models (based on site prediction).
3chy 1 C-term H1 H5 N-term S4 2 S3 S2 S1 S5 3 H2 H4 H3 Helix and strand order: H1(1,5);S2(2,1,3,4,5);H3(2,3,4)
Proximity plot:3chy Best model in each foldtype native Correct model
Thioredoxin: 2trxA correct incorrect incorrect H5 Rank 1 Rank 4 Rank 10 (last)
Conclusions • The requirement of proteins to form functional sites - used to select the correct protein fold. • In larger proteins, difficult due to the conformation of longer loop • The competing incorrect folds - mostly strand swapped models. • Discriminates between incorrect fold and correct efficiently when the direction of secondary structure element that contain functional residues is altered and when the fold is messy.
Thanksto • Dr Willie Taylor National Institute for Medical Research, Mill Hill, London, UK. • Prof Sir Tom Blundell Department of Biochemistry, University of Cambridge, Cambridge, UK.