Why Stochastic Hydrology ?
410 likes | 434 Views
Investigating hydrologic systems through stochastic modeling, Monte Carlo simulations, and reservoir analysis for advanced decision-making in water resource management.

Why Stochastic Hydrology ?
E N D
Presentation Transcript
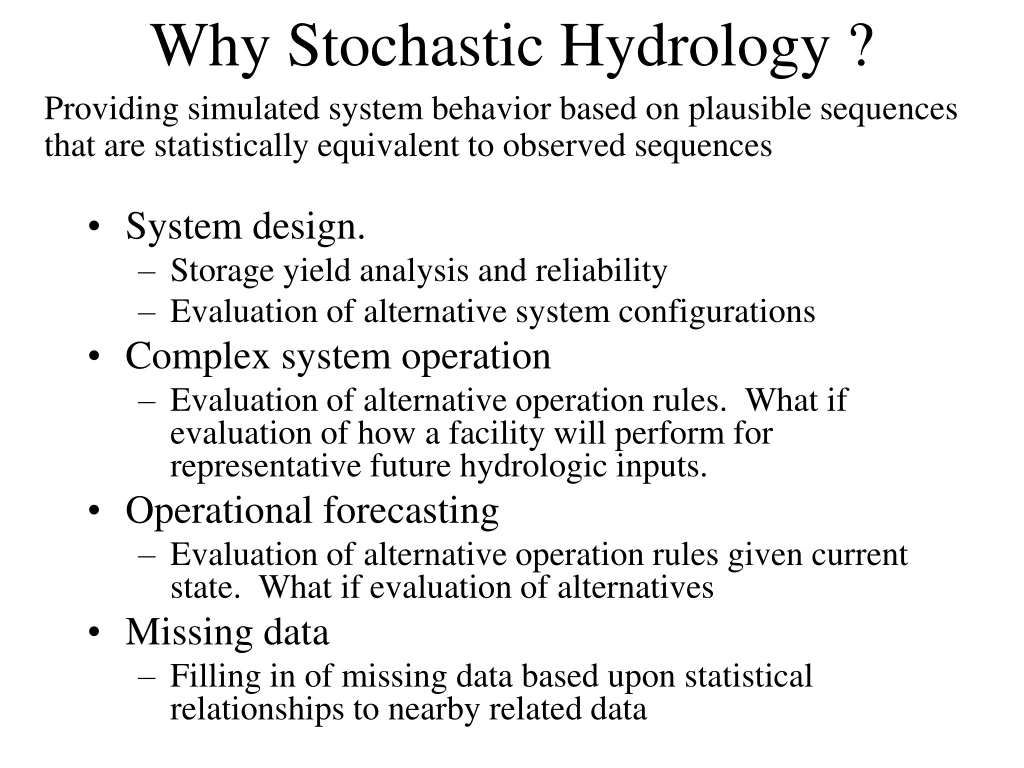
Why Stochastic Hydrology ? Providing simulated system behavior based on plausible sequences that are statistically equivalent to observed sequences • System design. • Storage yield analysis and reliability • Evaluation of alternative system configurations • Complex system operation • Evaluation of alternative operation rules. What if evaluation of how a facility will perform for representative future hydrologic inputs. • Operational forecasting • Evaluation of alternative operation rules given current state. What if evaluation of alternatives • Missing data • Filling in of missing data based upon statistical relationships to nearby related data
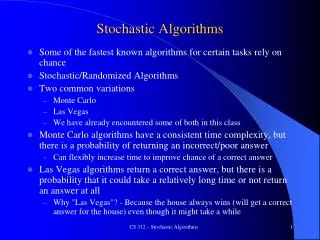
The Monte Carlo Simulation Approach • Streamflow and other hydrologic time series inputs are random (resulting from lack of knowledge and unknowability of boundary conditions and inputs) • System behavior is complex • Can be represented by a simulation model • Analytic derivation of probability distribution of system output is intractable • Inputs generated from a Monte Carlo simulation model designed to capture the essential statistical structure of the input time series • Monte Carlo simulations solve the derived distribution problem to allow numerical determination of probability distributions of output variables
From Bras, R. L. and I. Rodriguez-Iturbe, (1985), Random Functions and Hydrology, Addison-Wesley, Reading, MA, 559 p.
Streamflow Modeling • A stochastic streamflow model should reproduce what are judged to be the fundamental characteristics of the joint distribution of the flows. • What characteristics are important to reproduce?
Alafia river: Autocorrelation Autocorrelation of standardized flow
Storage-Yield Analysis • Used to size a reservoir given a streamflow time series • Store during high flows, release during low flows
Rt = y Storage-Yield Analysis • Sequent Peak Procedure Kt = Kt-1 + Rt – Qt If Kt < 0, Kt=0 S = Max(Kt)
Box Plot Outliers: beyond 1.5*IQR Whiskers: 1.5*IQR or largest value Box: 25th %tile to 75th %tile Line: Median (50th %tile) - not the mean Note: The range shown by the box is called the “Inter-Quartile Range” or IQR. This is a robust measure of spread. It is insensitive to outliers since it is based purely on the rank of the values.
From http://www.nytimes.com/2008/02/13/us/13mead.html Barnett, T. P. and D. W. Pierce, (2008), "When will Lake Mead go dry?," Water Resour. Res., 44: W03201, http://dx.doi.org/10.1029/2007WR006704
National Research Council Committee on the Scientific Bases of Colorado River Basin Water Management, (2007), Colorado River Basin Water Management: Evaluating and Adjusting to Hydroclimatic Variability, National Academy Press, Washington, DC, http://books.nap.edu/catalog.php?record_id=11857.
Tarboton, D. G., (1994), "The Source Hydrology of Severe Sustained Drought in the Southwestern United States," Journal of Hydrology, 161: 31-69.
General form of a stochastic hydrology model Qt=F(Qt-1, Qt-2, …, random inputs) Example Regression of later values against earlier values
The modeling process • Data gathering and exploratory data analysis • Conceptual model development (hypothesis formulation) • Applying various forms of models to see which relationships work and which do not. • parameter estimation • diagnostic testing • interpretation of results
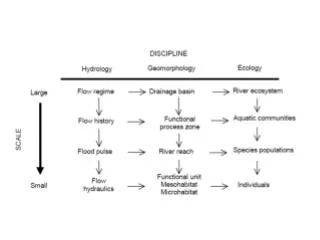
Conceptual model of system to guide analysis Natural Climate states: ENSO, PDO, NAO, … Other climate variables: temperature, humidity … Rainfall Management Groundwater pumping Surface water withdrawals Groundwater Level Surface water releases from storage Streamflow
Independent variable x-value Predictor Input Models to Represent the Relationships Between Variables • Dependent variable • y-value • Predictand • Output
Time series function fitting x1 x2 . . xt . .
Notation N number of data points in sample x single data value called x - usually input y single data value called y - usually output single predicted output“y hat” xt single data value at point in time “t” xt-2 single data value 2 points in time previous to the current time x1 single data value at time t=1
Notation , , ..., (greek letters) - parameters for function fitting parameters estimated from data Error Standard deviation Summation, for example: xi single data value at point “i” used in summations
Notation xvector or matrix of x values (note use of notation we just defined!) vector: one dimension or variable; matrix: n rows, m columns. Rows may represent variables data vectors at sequential times. X (uppercase x) Random Variable (used in derivations) or matrix (H)
Terminology Functional relationship
Statistical learning • Learning from data • Training data set used to build prediction model (the learner) • Use the model to predict the outcome of unseen objects (inputs) • Supervised learning, because it used the presence of outcome variables to guide the learning (fitting) process • Known as a regression problem when the outcome is quantitative
x1 x2 x3 y x1 x2 x3 y ……… x1 x2 x3 y x1 x2 x3 y Input Output General function fitting – Independent data samples Independent data vectors Example linear regression y=a x + b+
Time series autoregressive function fitting – Method of delays Embedding dimension x1 x2 x3 x4 x2 x3 x4 x5 x3 x4 x5 x6 ……… xt-3 xt-2 xt-1 xt ……… Samples data vectors constructed using lagged copies of the single time series ExampleAR1 model xt = xt-1 + Trajectory matrix
Limitations of Stochastic Hydrology • Stochastic Hydrology can not create more information than already exists in the available data. What it does do is provide a methodology to help decision makers find the answers to "what if" questions by providing simulated system behavior based on plausible sequences that mimic the records that are already available (Pegram, 1989)
Why Stochastic Hydrology • Because although future rainfalls and streamflows will most likely resemble the past in a broad sense (such as mean values, variability and intercorrelation) all future sequences are almost surely going to be different in detail from what has been observed in the past (Pegram, 1989)