Download
1 / 28
280 likes | 428 Views
Measurement of the Beam Longitudinal Profile in a Storage Ring by Non-Linear Laser Mixing. J.-F. Beche, J. Byrd, S. De Santis , P. Denes, M. Placidi,W. Turner, M. Zolotorev. Lawrence Berkeley National Laboratory. Online measurement of bunch length and shape

E N D
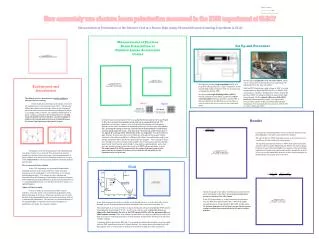
Measurement of the Beam Longitudinal Profile in a Storage Ring by Non-Linear Laser Mixing J.-F. Beche, J. Byrd, S. De Santis, P. Denes, M. Placidi,W. Turner, M. Zolotorev Lawrence Berkeley National Laboratory
Online measurement of bunch length and shape Bunchcurrent – including nominally unfilled RF buckets (“ghost bunches”) Synchronous bunch position Fast: the results shown were accumulated in seconds/minutes Very wide dynamic range (104) All-in-One Tool for Synchrotron Rings
Longitudinal Density Monitor overview what it does, how it does it The hardware Experimental runs at the ALS Applications to LHC and NLC Summary
A Brief History • Original concept: femtoslicing experiments at the ALS (R. Schoenlein and M.Zolotorev, 2000) • Prototype: LHC Accelerator Research Program (2002-03) • Longitudinal dynamics studies in damping rings (?)
An Optical Sampling Scope 1+2 = visible wavelength Mixed Photons 1+2 Bunch Synchrotron Photons 1 PMT Non-linear crystal [BBO] Laser Photons 2 Filter(1+2) laser pulse length << bunch length
Scanning the Bunch LHC: 40 MHz ALS: 71 MHz Piezo-ceramic positioner L ALS: 10 Hz C/2L = 40 (or 71) MHz Adjust by changing path length (phase modulation) Laser 100-200 mW diode-pumped laser LHC: 22 bins (std. mode) ALS: 32 bins ALS: 50 fs, LHC: 50 ps (10 W)
Orbit clock Schematic (timing) Ring main RF (PLL) Synchrotron Light Laser Timing Board Timing PD Laser BBO ADC Filter Processing +Interface (USB to PC) PMT Cavity Control DAC ADC
Architecture – Different Boards #1 : Phase modulation Generator #2 : Phase Information Digitization #3 : PMT pulse digitization #4 : Delay generators/timing #5 : Digital Backend (Storage and USB) LDM – Electronics Board Layout PC 5 1 2 3 4 From PMT From Photodiode To Laser Phase Offset
Electronics - I. Mother Board with 71MHz clock board USB Control and histogram/average is fully operational
Electronics - II. DAC Analog board for laser phase offset modulation Actual Laser phase offset digitization board Track and Hold board with self trigger for PMT pulse detection (only one bit is used in single photon counting mode)
Standard DAQ Board Function Library Labview, C/C++ compatible Quad 8-bit I/O board, DMA transfer rates up to 20MHz (8, 16 or 32-bit) DAQ PCI6534 National Instruments
Tests at the ALS (LHC parameters) 328 RF buckets 276+1 filled (280-620 ps) Bunch width ~50 ps (2808/35640) (2.5 ns) Bucket spacing 2 ns “Camshaft” pulse Gap
delay w1 = 1.55 eV Laser System w1+ w2 wiggler BBO synchrotron radiation bend magnet slit e-beam w2 = ~2 eV mirror L= 800 nm, S= 638 nm =355 nm Optical layout at the ALS Conversion efficiency is proportional to the laser power density and is optimized for = S
First Experimental Data (Nov. 2002) First data (Peak Height distribution) Electronics Setup
Zoom in... SET3
Compress Scale... SET3
Large dynamic range SET3
Background Camshaft/Background ~ 103
Bunch Length SET3
A Longitudinal Monitor for LHC • 450 GeV - 7 TeV • Untrapped beam fraction • Protons in the abort gap • Longitudinal bunch tails • “Ghost bunch” population • Etc.
Bunch core measurement (std. mode) Tails and “ghost bunches” (HS mode) LHC Applications of LDM • 10 W laser @ 1064 nm • Laser pulse period: 25 ns • Laser pulse length: 50 ps • LHC length: 88.9 µs • Photons/bunch/turn: 10’s (102 gain @ 450 nm) at full current
Bunch core measurement • Measure bunch population at ±2s with 1% accuracy in a time short compared to the synchrotron period (~42 ms @ 7 TeV) • 22 bins required (50 ps x 22 ≈ ±2s). • Time required to map the core once: 22 turns ≈ 2 ms • Expected population: 2·108- 2·106 p/ps. • Accuracy: 0.5-5.5%
Tails and “ghost bunches” measurement • Measure bunch populations as small as 2·104 p/ps all around the ring (causing background in experiments) with ~50% accuracy. • Entire ring is mapped in 50 ps slices. Minimum number of turns: 500 (3556 slices/turn). • At 7 TeV, (2±0.8)·104 p/ps give 3.2 ±1.8 counts in a 50 ps slice. • 1000 turns (< 100 ms) are required for the 50% accuracy as per specs. LDM is the ideal instrument...
Longitudinal dynamics in the machine never reaches a steady state + short bunches the LDM can be a valuable tool for understanding/monitoring the damping rings. NLC Damping Rings Parameters • E = 1.9 GeV • C = 300 m • z= 12 ps • ∆tb= 1.4 ns • Nb= 576/714 (3 trains, laser @ 71 MHz can sample 20 bunches x train) • S= 0.0035 (~300 turns) • Long. damping time = 2.6 ms (2600/3 turns)
Fast sampling rate (laser cavity frequency) High dynamic range High time resolution (laser pulse length) Not limited to optical wavelengths Requires multi-turn sampling Requires synchrotron light Conclusions: Pros and Cons of LDM Especially suited for dynamics studies in damping rings