Download
1 / 47
470 likes | 576 Views
Magnitude and t i me course of illusory translation perception during off-vertical axis rotation Rens Vingerhoets Pieter Medendorp Jan Van Gisbergen. Contents. Contents Introduction - Sensors - Off-vertical axis rotation - Models Methods Results - Verbal estimates

E N D
Magnitude and time course of illusory translation perception during off-vertical axis rotation Rens Vingerhoets Pieter Medendorp Jan Van Gisbergen
Contents Contents • Introduction - Sensors - Off-vertical axis rotation - Models • Methods • Results - Verbal estimates - Psychophysical data • Model implications • Conclusions
Introduction - Sensors Sensory signals involved in spatial orientation: • Visual Cues • Semicircular canals • Otoliths • Somatosensory cues
Introduction - Sensors The semi-circular canals • Sensitive to angular acceleration • High-pass filter
Introduction - Sensors The otoliths • Sensitive to acceleration caused by: • Gravity • Inertial acceleration
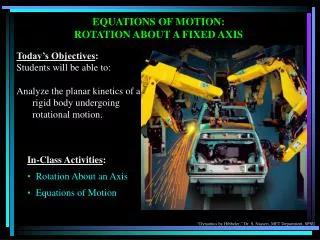
Vertical Axis Rotation Off-Vertical Axis Rotation Introduction What is off-vertical axis rotation (OVAR)?
Introduction • What is off-vertical axis rotation (OVAR)? • Rotation in yaw about an axis that is tilted relative to the direction of gravity. • Stimulation of both otoliths and canals Left Ear Down (LED) Nose Up (NU) Right Ear Down (RED) Nose Down (ND)
NU NU R RED LED RED LED ND ND Introduction What happens during OVAR? Left Ear Down (LED) Nose Up (NU) Right Ear Down (RED) Nose Down (ND) What causes this percept? Otolith signal from tilt interpreted as translation?
Introduction – Otolith Disambiguation Neural strategy for otolith disambiguation: Filter hypothesis Acceleration
Introduction – Otolith Disambiguation Neural strategy for otolith disambiguation: Canal-Otolith interaction Rotation Acceleration
Introduction – research question Do these models apply to self-motion perception during OVAR? To check this quantitative data is required
Methods Experimental setup Picture of vestibular chair
Methods Experimental setup • 6 subjects • 2 series (only clockwise rotation) • - Tilt series: 0, 15 and 30 deg tilt at 30 deg/s • - Speed series: 20, 30, 40 and 50 deg/s at 15 deg tilt • Each experimental condition consisted of 18-20 runs of 180 s each • Subjects indicated verbally when cone illusion started • Subjects reported the perceived radius • Self-motion percept quantified with laser method
v Experiment Laser method • Screen and motorized laser on board of the chair • Every NU and ND phase projection of moving laser dot • Subject indicated with a toggle switch if the dot was moving too fast/slow in direction opposite to perceived selfmotion • ‘Matching velocity’ obtained using two methods: • - 0-110 s: Adaptive staircase over runs • - 110-180 s: Method of constant stimuli
Results I Verbal Estimates
Results I – Verbal estimates Reported cone illusion latencies
Results I – Verbal Estimates Estimated Radii
Results II Time course
Results II – Staircase Data Staircase data from tilt series NU ND
Results II – Staircase Data Staircase data from tilt series NU ND
Results II – Staircase Data Staircase data from tilt series NU ND
Results II – Staircase Data Staircase data from speed series NU ND
Results II – Staircase Data • Summary staircase data • Stereotyped exponential decay to zero in 30-60 s in zero-tilt condition • During OVAR short exponential decay followed by bifurcation into two opposite velocity levels • Results in agreement with anecdotal reports • Bifurcation depends on tilt angle • Bifurcation depends on rotation speed
Results III Decomposition of response curves
Results III - Decomposition Decomposition of response curves • Two processes (R & T) underlie self-motion perception. • R follows the same time course in both phases (NU & ND) • T has opposite sign in both phases • Hence, matching velocity is: • VNU = R +T • VND = R – T • Consequently: • R = (VND + VNU)/2 • T = (VNU - VND)/2 T R + NU RED LED ND T R +
Results III - Decomposition Decomposition data from tilt series R T
Results III - Decomposition Decomposition data from tilt series R T
Results III - Decomposition Decomposition data from tilt series R T
Results III - Decomposition Decomposition data from speed series R T
Results III - Decomposition • Summary decomposition data • R component shows exponential decay to zero independent of tilt angle and rotation speed • T component starts at zero and gradually climbs to an asymptotic level. • T component increase not always starts right after rotation onset • Asympotic value of T component depends on tilt angle and rotation speed.
Results III - Decomposition Fit to decomposition data Rotation component: R(t) = A * exp(-t/TR) Translation component: T(t) = 0 if t < T T(t) = B * (1 – exp((-t-T)/TT) if t > T
Results III - Decomposition Examples of fit
Results III - Decomposition Fit parameters show us: • R component • R(t) = A * exp(-t/TR) • TR is constant across experimental conditions • Initial amplitude (A) of R component increases with increasing rotation speed • T component • T(t) = 0 if t < T • T(t) = B * (1 – exp((-t-T)/TT) • Incorporating a delay (T ) is essential • Inter-subject differences for delay and TT • Translation percept (B) increases both with tilt angle and rotation speed.
Results IV Constant stimuli data
Results IV – Constant Stimuli Constant stimuli data from tilt series NU ND
Results IV – Constant Stimuli Constant stimuli data from speed series NU ND
Results IV – Constant Stimuli • Summary constant stimuli data • Observations from staircase data confirmed: • Increase of matching velocity with tilt angle • Increase of matching velocity with rotation speed • Width of psychometric curve increases with rotation speed
Canal-otolith interaction Filtering Models Model predictions 30o/s and 15o tilt
Models Model predictions 30o/s and 15o tilt Canal-Otolith
Models Model predictions 30o/s and 15o tilt Canal-Otolith Filter
Models Model predictions 30o/s and 15o tilt Data Canal-Otolith Filter Models cannot account for observed time course
Models Model predictions 15o tilt Data Canal-Otolith Filter Models predict too large translations
Conclusions • We have developed a method that is able to capture the motion percepts that occur during OVAR • Contemporary model hypotheses such as canal-otolith interaction and frequency segregation cannot explain our results
(-w x g)dt (-w x g)dt g = g = ˆ ˆ ˆ Merfeld Canal-otolith interaction model w w S (s) scc g + a f oto a scc S (s) oto - a Body Dynamics Sensory Dynamics + - e f e w x a a ˆ e = f + a a ˆ e a k k k k a f w f - w + g ˆ ˆ - f a ˆ S (s) oto ˆ + + w ˆ + a ˆ ˆ a g oto scc ˆ f w S (s) + scc Model of Body Dynamics Model of Sensory Dynamics g ˆ ˆ ˆ w a