Download
1 / 35
350 likes | 530 Views
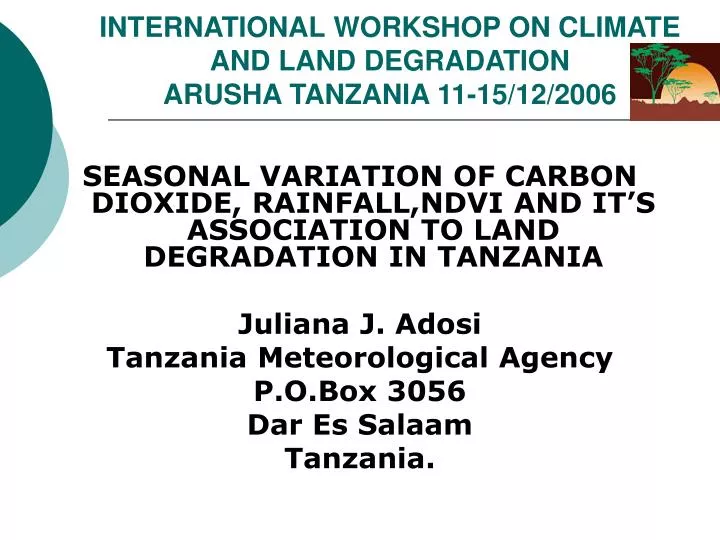
INTERNATIONAL WORKSHOP ON CLIMATE AND LAND DEGRADATION ARUSHA TANZANIA 11-15/12/2006. SEASONAL VARIATION OF CARBON DIOXIDE, RAINFALL,NDVI AND IT’S ASSOCIATION TO LAND DEGRADATION IN TANZANIA Juliana J. Adosi Tanzania Meteorological Agency P.O.Box 3056 Dar Es Salaam Tanzania. ACKNOWLEGEMENT.

E N D
INTERNATIONAL WORKSHOP ON CLIMATE AND LAND DEGRADATIONARUSHA TANZANIA 11-15/12/2006 SEASONAL VARIATION OF CARBON DIOXIDE, RAINFALL,NDVI AND IT’S ASSOCIATION TO LAND DEGRADATION IN TANZANIA Juliana J. Adosi Tanzania Meteorological Agency P.O.Box 3056 Dar Es Salaam Tanzania.
ACKNOWLEGEMENT Lonnie Thompson, University of Ohio, USA Douglas Handy, University of Massachusetts, USA Dave in USA Georg Kaser, Thomas MÖlg, Nicolas Cullen, University of Innsbruck, Austria Blessing Siwale, DMC Harare Dr. Mohamed Mhita, Emanuel Mpeta, Tharsis Hyera: TMA Tanzania
1.0 INTRODUCTION • Over the recent decades many parts of the world have experienced high frequency of extreme weather events such as floods and droughts which have been linked to climate change. • The main indicator of climate change has been the rise in global temperature which has principally been linked with increase of carbon dioxide in the atmosphere. Instrumental records indicate an increase of ≈0.3-0.6°C in global mean surface temperature over the last 100 years (IPCC, 1992; 1995; 2001).
INTRODUCTION CONT’ • A study on the space time characteristics of minimum and maximum temperatures over Tropical East Africa indicate positive trend (Ogallo, 1993; King’uyu, 1994); Scenario of Climate Change (Matari and Hyera, 1996); Trends and Variability of Surface Temperature Over Tanzania, (Adosi, 2002); • Rise in global temperature will cause the melting of glaciers and polar ice caps which may lead to sea level rise resulting to problems like: • Health • Environmental • Social and economic.
1.1 OBJECTIVE The main objective of the study is to examine the seasonal variation of CO2, rainfall, NDVI and it’s association to land degradation in Tanzania. To archive this the following is going to be done: • Find annual and seasonal variation of CO2. • Find time series and seasonal variation of NDVI and rainfall. • Relate the above to their association with land degradation.
TANZANIA STATION DISTRIBUTION FOR RAINFALL AND NDVI Figure 1
2.0 DATA AND METHODOLOGY • Mean monthlydata for CO2 for Mahe (Seychelles) carbon dioxide baseline station, NDVI from DMC Harare, rainfall from TMA were used in this study • The data was subjected to standard statistical methods of time series analysis, which included trend and spectral analysis on monthly, seasonal and annual time scale.
3.0RESULTS AND DISCUSSIONMONTHLY NDVI 1982-2005. Figure 3 (a) (b) (C) (d)
MONTHLY NDVI CONT’ From figure 3 the NDVI shows high values in May / December when the land has maximum foliage cover after the long / short rains in areas with bimodal rainfall distribution ( Musoma, Bukoba, Arusha, Tanga and Dar es Salaam). In areas with unimodal rainfall distribution the high values in NDVI are observed in March/April (Kigoma, Tabora, Dodoma, Morogoro,Songea) the period of maximum foliage cover.
TABORA SEASONAL NDVI TIME SERIES 1982-2005. Figure 4 (a) (b) (c) (d)
TABORA SEASONAL NDVI CONT’ Seasonal analysis of NDVI in the country shows that the vegetation index decreases and increase in some seasons. • A significant decrease has been noted in Tabora SON with R2≈0.6446, figure 4. • Arusha and Dodoma has negative trend in all seasons, table 1. This signifies a decrease of rainfall or deforestation. Grazing is dominant in these regions. With a reduction of vegetation the consumption of CO2 is reduced, hence accumulation in the atmosphere.
SEASONAL NDVI TREND CHARACTERISTIC IN TANZANIA 1982-2005 Table 1
Tabora rainfall time series Figure 5 (a) (b) (c) (d) Increasing trend in DJF, MAM, JJA but decreasing NDVI in SON
Tabora rainfall time series Cont’ Rainfall time series shows that rainfall is increasing in some parts of the country while the NDVI is decreasing (Shinyanga, Morogoro, Mbeya, Tabora) may be due to: • deforestation going on in the area. • Over grazing • Forest fire & deliberate fire for clearing farms • Only Songea has positive trend in NDVI and rainfall in MAM and JJA. • Tanga and Kigoma has a decrease in rainfall but an increase in NDVI in DJF, MAM and JJA table 1 and 2.
RAINFALL TREND SIGN. Table 2
3.0 Monthly concentration of CO2 • bimodal distribution is evident with minimum in January and May the time when we have high values in NDVI. This pattern may be associated with seasonal variation in the vegetation cover through (photosynthesis). Figure 6
3.2 SEASONAL TREND OF CO2 Figure 7 (a) (b) (c) (d)
SEASONAL TREND OF CO2 CONT’ Figure 3 shows that On seasonal basis : • (SON) has the largest trend ≈ (1.48) • MAM has the lowest trend ≈ (1.42) This can be related with the vegetation cover, SON the land is bare, forest fire and most of the people prepare their farms by burning. While in MAM the land has maximum foliage cover.
3.3 CO2 ANNUAL VARIATION. • CO2 is increasing at ≈ (1.42) ppm per annum. Figure 8
FIRE: FOREST & FARM CLEARING IN MOROGORO Figure 9 (a) (b)
BURNED / DROUGHT Figure10 (a) (b) BARE LAND DUE TO DROUGHT/BURNING ERODED BARE LAND AFTER FLOODS IN DODOMA
DROUGHT IN TZ 2005 Figure11
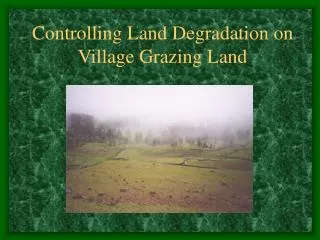
OVER GRAZING Figure12
FLOODS AND DROUGHTS Figure13 FLOODS DAR ES SALAAM 2006 DROUGHT DAR ES SALAAM 2005
KILIMANJARO’S FOREST Figure14 (a) (b) THICK FOREST MOORLAND
KILIMANJARO FIRE Figure 15 (a) (b) LAND VULNERABLE TO DEGRADATION FOREST RECOVERING
KILIMANJARO GLACIER IN DANGER Figure 16
Mt. KILIMANJARO GLACIER Figure 17 17/2/1993 21/2/2000 (a) (b)
KILIMANJARO CRATER AERIAL VIEW Figure 18 CRATER CURRENT (JULY 2005) (b) (a) EARLIER
LAND DEGRADATION AT 500hPa KILIMANJARO(5895m) Figure 19 40-50m 20-30m (b) (a)
LAND DEGRADATION AT 500 hPa CONT’ Overview of Met. station locations: Figure 20 Northern Icefield (NFI) station Vertical wall station Crater NIF EIF (SIF) (a) Slope glacier station (b)
CONCLUSION This study shows that: • An increase of CO2 will cause increased land degradation due to increase in frequency and intensity of severe weather and extreme climatic events (floods & droughts) • Increased land degradation will lead to: -Reduced retention of soil moisture -Increased soil erosion
5.0 RECOMMENDATIONS. • To reduce land degradation planting of trees to capture desertification is recommended. • New and affordable energy source should be sought to reduce distraction of forests. • Institute proper land use plans.