Download
1 / 43
430 likes | 510 Views
Discover how the Univ. of Missouri-Rolla empowers students through technology-based education, research, and leadership programs. Learn about success indicators and initiatives to address enrollment challenges. Dive into the mission and core values of this technological research university.

E N D
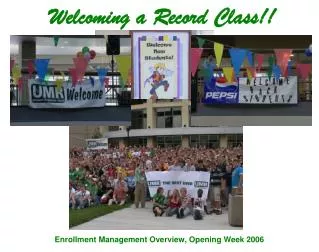
Welcoming a Record Class!! Enrollment Management Overview, Opening Week 2006
Our Mission: The University of Missouri-Rolla, Missouri’s Technological Research University, offers educational programs in major disciplines that are technology-based, technology-dependent, or complementary to these programs and is responsible for meeting Missouri’s need for engineering education. It is a premier source of leaders for our rapidly changing society -- leaders able to identify and solve complex societal and technical challenges; to create, assimilate, synthesize and communicate knowledge; to work effectively as team members in diverse environments; to adapt to change through life-long learning; and to improve quality of life for the citizens of the state and nation. UMR conducts nationally recognized research and develops and integrates new technologies in areas which improve the well-being of our citizens. The university stimulates economic development by creating and disseminating knowledge, by providing an educated work force, by encouraging and providing continuing education for lifelong learning, and by fostering partnerships among university, industry, and government groups. UMR emphasizes a broad range of educational and research programs with special emphasis on science and technology. (Approved December 2005 Board of Curators’ Meeting) Educating Tomorrow’sLeaders
What is a Technological Research University? • Technological research universities distinguish themselves by having a mission-based commitment to improving lives and the world through the study and application of advanced science and technology. • Most of today’s prestigious technological universities have a reputation for providing superior education and research programs in the sciences, technology, engineering, mathematics (STEM), the humanities and business management fields.
Benefits & Liabilities of Technological Research Universities • Benefits: • Attract very bright students who want to change the world for the better • The mission creates a learning environment that spurs new developments for improving life and the society through new knowledge and economic development • Liabilities: • A decreasing pool of students interested in the STEM fields makes it difficult to grow both a traditional and diversified student body • The academic programs are more expensive than the traditional liberal arts education
Success Indicators • Starting salary of graduates +$51K • 10th in the nation for number of doctoral engineering degrees granted to women • 22nd in the nation for number of engineering degrees granted • Over 500 recruiters attend on-campus career fairs annually
Success Indicators • 22nd on list of “America’s Most Entrepreneurial Campuses” Source: Forbes magazine • One of the nation’s 25 “most connected campuses” Source: Forbes.com/Princeton Review • A top 25 civil engineering program Source: America’s Best Colleges Guidebook 2004
Enrollment Management Missionapproved: June 2001 • The Division of Enrollment Management coordinates enrollment services for the University, working collaboratively with the academic units, student affairs and administrative units to identify and implement processes to meet, and strive to exceed student/customer expectations and University goals.
EM at UMR Research, Recruitment & Retention: focus on student assessment and modeling successes • Admissions • Registrar • Student Financial Assistance • Orientation / New Student Programs • Women’s Leadership Institute • Student Diversity Programs • Pre-College Programs • Visitor Center
The Core Understandings of UMR EM: • We exist to help and serve students the best we can • Be honest and positive at all times. Never feel pressure to make things up or answer questions you do not know the answers to. Feel free to say, “I don’t know,but I will find out and get back to you.” • You are the University – everything you say, how you look and act will be the guests vision and image of UMR. Take your role and the responsibility that goes with it very seriously.
The Core Expectations • Managerial Philosophy: the “Platinum Rule” • Student Service Philosophy: Find ways to say “YES” • Operational Philosophy: Make data based decisions & do the basics better than everyone else
Enrollment Concerns & Challenges in 2000 • 8 Year Decline New Students (-700 students) • 52% Graduation Rate • 82% Retention Rate • 22% Female Enrollment • 4% Traditionally Underrepresented Minorities • Only 1 New UG Degree Program (Computer Engineering) added to UMR’s Academic Portfolio in about 10 years • Campus Residence Halls and Courses have 10-15% Open Capacity • Industry Asking for MORE Graduates • Declining Student Interest in Engineering, Computer Science, Physics, Chemistry, and Math • A Fast Approaching Decline in Midwestern College-Bound Students
Enrollment Status & Challenges in 2005-06 • 5 Year Growth Pattern in all Strategic Plan Areas • 64% Graduation Rate (UMR Record) • 87% Retention Rate (UMR Record) • 23% Female Enrollment (+170 new students) • 5 Year Increase (+978 students) • New School of Management, 8 new Mission Based Degree Programs and 17 Graduate Certificate Programs • Campus Housing and Classes are very full • Industry STILL Asking for MORE Graduates • FURTHER Declines in Students Interested in Engineering, Computer Science, Physics, Chemistry, and Math degrees/careers • A MUCH FASTER Approaching Decline in Midwestern College-Bound Students
Expected EnrollmentSTRATEGIC PLAN GOAL: Grow to 6500-7000 Students • TOTAL Enrollment 5720 • Undergraduate Students 4400 • Graduate Students 1300 • Freshman class +970* * 2003, 2004, 2005, 2006 Largest New Student Classes in 15 years • Class Locations • Campus: 91% • Distance: 9%
2005 Undergraduate Demographics • Average Age: 21.6 years old • Gender: • 23% Female • 77% Male • First Generation College Students: • 2005-06: 37% • Residency: • Missouri Residents: 76% • Out-State Students: 24% • Ethnicity: • African-American: 4% • Asian-American: 3% • Caucasian: 83% • Hispanic: 2% • Native-American: 1% • Non-resident, International: 2% • Not Disclosed: 5%
Due to Low Market Interest in STEM Majors, UMR Embraced a Segmentation and Communication Strategy to Increase Enrollment by Improving the Yield of Admitted Undergraduate Applicants who Enroll
SCHUY- LER LIVING- STON MONT- GOMERY ST CHARLES ST LOUIS ST GAS- LOUIS CITY CON- ADE JEFFER- SON Legend 50 or more students 10 – 49 students 1 - 9 students No students WASHING- STE TON GENEVIEVE ST ST FRANCOIS FRANCOIS CAPE GIRARDEAU BOLLIN- GER MISSIS- SIPPI NEW MADRID PEMI- SCOT University of Missouri - Rolla Geographic Origin of All Students – Preliminary Fall 2005 ADAIR SCOTLAND PUTNAM WORTH MERCER 2 1 4 CLARK 3 ATCHISON 3 1 HARRISON NODAWAY 0 GENTRY 1 8 SULLIVAN All Students, Totals Missouri 3,875 Other Locations 1,727 Total 5,602 11 GRUNDY 2 KNOX 1 LEWIS HOLT 3 4 3 3 DAVIESS ANDREW MACON DE KALB LINN 6 3 MARION 1 SHELBY 7 8 26 4 6 24 CALDWELL CLINTON RALLS BUCHANAN 1 11 CHARITON 4 MONROE CARROLL RANDOLPH 4 PIKE 3 12 RAY 3 PLATTE CLAY 9 48 9 AUDRAIN 75 15 HOWARD SALINE LINCOLN 6 BOONE LAFAYETTE 6 15 38 JACKSON 60 227 COOPER CALLAWAY 12 WARREN 3 919 17 27 45 JOHNSON PETTIS 345 21 MONITEAU 7 CASS 37 9 COLE OSAGE 84 FRANKLIN 15 MORGAN 21 HENRY 108 5 BENTON 8 174 BATES MARIES MILLER 1 22 3 28 CAMDEN CRAWFORD ST. CLAIR 21 42 HICKORY PHELPS 41 4 14 2 PULASKI 12 VERNON PERRY 313 153 10 10 IRON CEDAR DALLAS LACLEDE 7 DENT POLK 9 22 8 MADISON 30 13 5 8 BARTON REYNOLDS 60 12 DADE TEXAS 3 WRIGHT WEBSTER 4 GREENE 21 14 3 135 WAYNE JASPER SHANNON SCOTT 49 LAWRENCE 4 20 12 CARTER 13 DOUGLAS CHRISTIAN STODDARD 7 7 49 NEWTON 9 2 16 BUTLER HOWELL RIPLEY STONE OREGON OZARK 20 BARRY 7 27 3 MCDONALD TANEY 5 12 14 6 9 1 Note: Geographic Origin is defined as student's legal residence at time of original admission to UMR. Source: Integrated Postsecondary Education Data System (IPEDS) frozen files, end of 4th week of classes. 11 4 DUNKLIN
RI DE DC MD Legend 50 or more students 10 – 49 students 1 - 9 students No students SO. CAROLINA University of Missouri - Rolla Geographic Origin of All Students - Fall 2005 ALASKA WASHINGTON 35 MAINE MONTANA NORTH DAKOTA MINNESOTA 5 5 OREGON VT 19 4 2 WISCONSIN NH 3 14 IDAHO 10 SOUTH DAKOTA 4 MA 14 4 NEW YORK CT MICHIGAN WYOMING 3 21 7 7 PENNSYLVANIA IOWA 14 NEVADA NEBRASKA 25 NJ OHIO 43 6 IN 2 UTAH ILLINOIS 10 17 5 369 WV 1 COLORADO VIRGINIA 5 DC 1 10 KANSAS 17 16 MISSOURI 123 KENTUCKY CALIFORNIA 3875 15 47 NO. CAROLINA TENNESSEE 4 51 ARIZONA OKLAHOMA ARKANSAS NEW MEXICO 10 72 9 6 MS GEORGIA ALABAMA 7 5 23 LA TEXAS 13 91 2 9 All Students, Totals United States 5,063 Other Countries 539 Total 5,602 FL 1 HAWAII VIRGIN ISLANDS 1 PUERTO RICO 1 Note: Geographic Origin is defined as student's legal residence at time of original admission to UMR. Source: Integrated Postsecondary Education Data System (IPEDS) frozen files, end of 4th week of classes.
UMR MAKING PROGRESS IN DIVERSITY:54% Growth in Under-Represented Students 2000 - 2005
Improving Student Success • Retention Rates 2005 • General Student Body: 87% (82% 2001) • Female Students: 88% • Minority Students: 89% • CAMPUS GOAL: 90% • Graduation Rates 2005 • General Student Body: 64% (52% 2001) • Female Students: 71% • Minority Students: 60% • CAMPUS GOAL: 70%
Source of Revenue Auxiliary, Gifts, & and Other 16% Tuition & Fees 33% Grants & Contracts 21% State Appropriations 30%
Projected Change in High School Graduates 2002-2012 +9 -17 -11 -20 -4 -10 +7 -10 -6 +11 -11 +4 -2 -22 -2 -1 -3 -8 0 -7 +53 -3 +10 +3 +5 +5 +7 -7 +4 +3 +12 +6 -6 -4 +3 -10 +13 +8 +20 -8 +2 -1 -3 +2 +16 -1 -12 +7 +9 +9 > 20 % +11% to +20% 0% to +10% Decreases -10 STAMATS, 2005
Concerning Student Interest Data Source: ACT 2004
Missouri’s 2005 Student Funnel for All Engineering Fields • High School Seniors: 61,378 • High School Graduates: 57,573 • ACT Testers/College Bound: 42,862 • Any Engineering Interest, all scores: 1,599 • Engineering Interest, +21 comp. score: 1,102 (21 = MO average score / 50%) • Engineering Interest, +24 comp. score: 789 (24 = UM minimum for auto admission) • UMR’s Freshmen Engineering Majors 534 from Missouri
Capacity for Enrollment Growth • Academic Space Assessment • Student Housing Capacity • Parking Capacity • Student Market Assessment • Enhancing the UMR Product / Academic Portfolio
Keys to Planning for 7000 Students • Achieve Retention Goal of 90% - 1st to 2nd year. • Enhance the New Student Marketing Efforts and Embrace the UMR Branding Strategy. • Continue department and faculty discussions on strategic course scheduling. • Goal of 1000 distance education students is possible: Need enthusiasm for distance learning to continue to grow. • Conduct a thorough parking study. • Refine and adjust non-engineering recruitment/marketing programs. • Scholarships will continue to be vital to our success.
Freshmen Class ProfileFall 2006 – Opening Week • Over 970 students One of the 3 largest and most talented classes in UMR history • 29 states (California to Virginia) • 15+ foreign countries • Ave. ACT: 27.2 (upper 10% in nation) • Ave. HS GPA: 73% have a 3.5 GPA or higher • Over 56% in upper 20% of High School Class • 88% interested in Engineering & Science fields • 20% Undecided on a Specific Major
Demographics • Women (23%) • Men (77%) • Age: 18 years or less (96.86%) • 77% Missouri • 21% out-of-state • 2% international • 8.6% Underrepresented/minority students • 63% are 2nd generation college students
Expectations • 36% plan to earn a graduate degree at UMR • 58% are likely to complete a graduate degree • 67% plan to complete a BS in 4 years or less • 81% plan to Co-op or Intern • 45% plan to study more than 11 hours per week at UMR • 76% studied less than 5 hours per week in high school • 97% plan to earn a 3.0 or higher UMR GPA • 52% plan to earn a 3.5 or higher UMR GPA • 91% plan to join a student organization • 51% would like to assume a student leadership position • 33% would like to study abroad
Activities • 58% were involved in varsity athletes in high school • 51% plan to be involved in recreational athlete activities • 48% plan to be involved in UMR student design teams • 26% plan to join a fraternity or sorority • 26% interested in academic or pre-professional organizations • 20% plan to be involved in music and theatre • 17% plan to be involved in religious based organizations
Decision Factors • 78% UMR: 1st choice college to attend • 18% UMR: 2nd choice college to attend • 9 Freshmen plan to transfer to another university • 70% became interested in UMR during Jr/Sr high school year • 60% first learned of UMR from family & friends • 97% chose UMR because it offered their desired Academic Program & its quality Academic Reputation • 85% Financial Aid/scholarship was important in deciding to attend UMR • 78% claim the personalized attention they received from UMR was important in deciding to enroll
Financial Issues • $67,355: average UMR family income • 75% are receiving scholarships & financial aid • 24% qualify for Pell Grants • 73% plan to work while enrolled at UMR • 26% already have/carry a credit card • 42% have an existing monthly balance • Only 6 students have 4 or more credit cards • 12 have over $1000 of credit card debt before enrolling at UMR
Faculty/Student Relationships • 94% plan to meet with faculty outside of the classroom/lab • 49% feel faculty should be very involved in their career development
Technology • 94% plan to bring a PC to campus • 69% will be new computers • 70% laptops • 4% Macintosh/Apple • 95% plan to bring a Cell Phone to campus • 51% spend more than 6 hours per week on the internet • 14% spend more than 15 hours per week on the internet