Download
1 / 23
230 likes | 467 Views
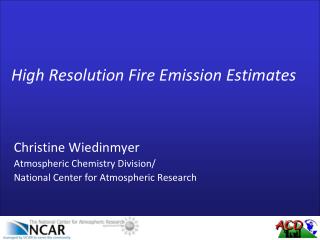
High Resolution Fire Emission Estimates. Christine Wiedinmyer Atmospheric Chemistry Division/ National Center for Atmospheric Research . Fire Emissions Development. Timing/location Area Burned Biomass (fuel) burned Emission Factors Chemical physical.

E N D
High Resolution Fire Emission Estimates Christine Wiedinmyer Atmospheric Chemistry Division/ National Center for Atmospheric Research
Fire Emissions Development • Timing/location • Area Burned • Biomass (fuel) burned • Emission Factors • Chemical • physical
Many efforts to develop fire emissions inventories & models • Global, regional, local • Various resolutions • Various species • Driven by different data (remote sensing/reports/both) I try here to summarize some of the major efforts that of which I am aware…
Local/Regional • U.S. NEI • 2002 inventory, detailed, developed by Air Resources, Inc. (Golden) • Emissions are included in the national EI, but unclear how emissions are spatially or temporally resolved. • STI/USFS • The USFS AirFire Team and Sonoma Technology, Inc. have developed the SMARTFIRE fire information system, which, in conjunction with the BlueSky Framework (http://blueskyframework.org), has been used by the EPA to develop wildland fire emissions for the National Emissions Inventory for recent years • Combines HMS data with local reports • Working with WRAP FETS • Local Agencies • E.g., CARB Emissions for California • David Lavoue, Canada • Detailed Canadian fire emissions • Working on expanding to N. America – including CONUS and AK
Continental/North & Central America • Wiedinmyer/NCAR model • Daily, 1km2 resolution • North and Central America: 2001-present • Global: 2007-present • Particles/ trace gases, working on speciation profiles for modelers • USFS Emissions (Wei Min Hao/Shawn Urbanski) • NASA NACP Project • 1 km2 resolution • CONUS / Canada/ North America • “The project currently has completed the mapping of burned areas at a 1 km × 1 km resolution from 2002 to 2008 and has produced the daily emission rates in 2007”
Continental/Global Efforts • Global Fire Emissions Database • Guido van der Werf and Jim Randerson • 8-day averages, 1 degree resolution • Based on MODIS fire counts (climate model resolution) • 1997-2008 • NASA Effort (Arlindo da Silva) • QFED • near-real time daily biomass burning emissions to support GEOS-5 aerosol forecasting • Up to 0.25 degree resolution
NOAA/NESDIS • WF_ABBA • Satellite detections from geostationary satellites • Global coverage coming soon (B. Pierce, NOAA) • Emissions modeling by Shobha Kondragunta and Xiaoyang Zhang • Operational for forecasting applications • Biomass burning emissions are produced once a day from GOES-E. The output parameters include: hourly emissions in PM2.5, CO, CO2, CH4, N2O, NH3, NOX, SO2, TNMHC, separately. • The emission data are available at http://satepsanone.nesdis.noaa.gov/pub/EPA/GBBEP • The product from GOES-W is available at: http://satepsanone.nesdis.noaa.gov/pub/EPA/GBBEP_W/ • A product is running internally every day to create emissions from MODIS, GOES and AVHRR. It provides hourly PM2.5, hourly burned area, and hourly FRP. The data cover CONUS originally and entire NA currently. • Hourly Global biomass burning emissions (PM2.5) is produced using fire radiative power from GOES-W and GOES-E (GOES 10, GOES 11, and GOES 12), MET09 and MTS01.
Issues • Political boundary issues • E.g., fuel loadings, reported information • Area and fuel burned estimation processes • Reports versus remotely sensed fire detections • Fire detections versus Fire Radiative Power to drive emissions • Emission factors • Plume Rise
Inter-comparison of methods Area Burned CO Emission J. Al-Saadi, 2008
CARB Emissions The California Air Resources Board uses a version of the federal First Order Fire Effects Model (FOFEM) customized to California and implemented in ArcGIS, to generate geospatially and temporally explicit inventories of criteria pollutant emissions from wild and prescribed fires in the state. The model uses GIS-based fire perimeters from a statewide fire geodatabase maintained by the Fire and Resource Assessment Program (FRAP) of the California Dept. of Forestry and Fire Protection (CAL FIRE). Fire perimeter GIS data are developed from field GPS data or from digitized aerial imagery. Rasters of thousand-hour fuel moistures (NFDR-TH) are also used by the model. NFDR-TH rasters are from the USDA-FS WFAS. For photochemical modeling, modeled emissions are apportioned by hour of the day and vertically into the boundary layer using a scheme developed by Dave Sandberg (USDA-FS PNW Research Station) for the Fire Emissions Joint Forum of the Western Regional Air Partnership (FEJF-WRAP). The fire emission inventories are fed into regional photochemical models used to simulate ozone and particulate matter statewide. CARB plans to also use the model to develop the statewide forest and rangeland greenhouse gas emission inventory. Updates to the model are also underway via a contract with Dr. Peng Gong of UC Berkeley.
STI/USFS The USFS AirFire Team and Sonoma Technology, Inc. have developed the SMARTFIRE fire information system, which, in conjunction with the BlueSky Framework (http://blueskyframework.org), has been used by the EPA to develop wildland fire emissions for the National Emissions Inventory for recent years. SMARTFIRE currently uses data from both the NOAA Hazard Mapping System (HMS) fire detects and the Incident Command System (ICS) 209 ground based reports. BlueSky can use a number of different fuel loading maps and consumption models, and various model pathways have been used, but the current standard is the FCCS fuel loading maps combined with the CONSUME3 consumption model. Significant upgrades to both SMARTFIRE and BlueSky are ongoing in collaboration with the WRAP, RSAC, CIRA, NRL, and UCAR. Near-term work for SMARTFIRE is being done to enable the inclusion of additional datasets that can be reconciled together to avoid double (or multiple) counting of the same fire. Datasets identified for inclusion first are the prescribed fire data from the WRAP's FETS system in conjunction with the WRAP and AirSciences, and the MBTS burn scar data from the USFS RSAC. A pilot study to examine how best to combine these datasets has been planned as collaborative project between the USFS, WRAP, STI, AirSciences, and CIRA. BlueSky improvements underway include the addition modules for satellite emissions calculation systems - specifically the system developed by Weidinmyer at UCAR and the FLAMBE system developed by the NRL Monterey, and other satellite data being incorporated for fuel moisture, plume rise, and other framework pieces. Comparison studies between various emissions calculation pathways (including the 12 currently in BlueSky and ones being added above) are currently being done under the Smoke and Emissions Model Intercomparison Project (SEMIP, http://semip.org), a JFSP project that has identified the 2008 NEI as a specific test case for comparison. Comparison results are currently available online at http://data.semip.org.
WRAP The WRAP's Fire Emissions Tracking System (FETS) is a web-enabled database for planned and unplanned fire events in the Western U.S. It is intended as a planning tool for daily smoke management coordination, and retrospective analyses such as emission inventories and regional haze air quality planning tasks. Current data status by fire type and smoke management program for activity reporting and subsequent emissions estimation are detailed in the attached FETS Data Status document, which is updated daily. Current FETS development work through 2010 will support routine daily FETS operations and add reporting of fire activity data for missing planned fire source categories (Prescribed Wildland, Agricultural, and Rangeland fire types) for Western smoke management programs not currently reporting to FETS. A proposal is in development for the EPA Emissions Inventory Group to expand FETS-style reporting for other state and smoke management programs across the U.S., to assist in review, quality assurance, and completeness of fire emissions reported in the EPA National Emissions Inventory system. Development of a top-down, first principles estimate of Residential Wood Combustion emissions across the West is under consideration to supplement the other biomass burning categories already tracked in FETS. WRAP-Air Sciences will be providing FETS applications and analyzing data as an integral part of a pilot study to examine how best to combine datasets from USFS-STI SmartFire/BlueSky Framework and USFS RSAC with FETS data, through a collaborative project between the USFS, WRAP, STI, AirSciences, EPA, and NPS. A key feature of the collaborative pilot project is to try to identify optimum combinations of data available and processing effort needed to produce high-quality datasets in 3 time frames: 1) short-term forecasting, 2) medium-term emissions inventory reporting/tracking, and 3) longer-term retrospective air quality planning datasets.
NASA (Arlindo Da Salva/Peter Colarco) We have been developing near-real time daily biomass burning emissions in support of our GEOS-5 aerosol forecasting system, the so-called Quick Fire Emission Dataset (QFED). These emissions are based on the MODIS fire products from both AQUA and TERRA satellites. The current algorithm (QFED v1) uses fire counts with constant emission factors calibrated against GFED v2. The new top-down algorithm being evaluated (QFED v2) uses MODIS Fire Radiative Power and will be attached to a plume rise model. The GEOS-5 aerosol forecasting system has a nominal resolution of 0.25x1/3 deg, globally. QFED v2 will match this resolution.
Hao/Urbanski (USFS) The fire and emission dataset used in the WRF-CHEM model is being developed as an extension of Dr. Hao‟s ongoing NASA North American Carbon Program (NACP) project, “Daily, Weekly, Seasonal and Interannual Variability of CO2, CO and CH4 Emissions from Biomass Burning in North America and Their Impact on Atmospheric Chemical Composition.” The final dataset will include the daily burned areas (Li et al., 2004), and associated emissions of CO2, CO, CH4, volatile organic compounds, PM2.5, and black carbon and organic carbon of aerosols (Urbanski et al., 2008, 2009) at a 1 km × 1 km resolution for the continental U.S. from 2002 to 2010. It is the most comprehensive high-resolution dataset for the spatial and temporal distribution of biomass burning and associated emissions in the U.S. The project currently has completed the mapping of burned areas at a 1 km × 1 km resolution from 2002 to 2008 and has produced the daily emission rates in 2007.
NOAA/NESDIS The biomass burning emissions in the North America are operational products in NOAA/NESDIS. They are publicly accessible via the URL that I provided in the slides. The emissions were calculated from 2001. The global estimates are hourly with a spatial resolution of 4km.
NOAA/NESDIS Operational Products of Biomass Burning Emissions Derived From Satellite-based Active Fires Shobha Kondragunta and Xiaoyang Zhang
Burned Area Simulated from Active Fires in 2005 Hourly burned areas are produced from active fire observations using diurnal pattern in near real time.
Fuel Loadings Estimated from MODIS Vegetation Properties (1KM) • Forest foliage • forest branch • shrub • grass • litter • coarse woody detritus (ton/ha)
Operational product of Biomass Burning Emissions from GOES-E • Biomass burning emissions are produced once a day. The output parameters include: hourly emissions in PM2.5, CO, CO2, CH4, N2O, NH3, NOX, SO2, TNMHC, separately. • The emission data are available at http://satepsanone.nesdis.noaa.gov/pub/EPA/GBBEP/
Operational Biomass Burning Emissions from GOES-W • Biomass burning emissions derived from GOES-W cover west part of North America. The output has the same format as GOES-E emissions • The product is available at: http://satepsanone.nesdis.noaa.gov/pub/EPA/GBBEP_W/
DOY 173 165DOY Emissions from MODIS+AVHRR+GOES This product is running internally every day. It provides hourly PM2.5, hourly burned area, and hourly FRP. The data cover CONUS originally and entire NA currently.
Global PM2.5 Emissions from Fires in September 15, 2009 Hourly Global biomass burning emissions (PM2.5) is produced using fire radiative power from GOES-W and GOES-E (GOES 10, GOES 11, and GOES 12), MET09 and MTS01.