Download
1 / 37
370 likes | 491 Views
Accountability Systems. Warm Up Questions. Do RFEPs count in the EL subgroup for API? How many “points” is a proficient score worth? Does a passing score on the CAHSEE equal a proficient score? How many different significant sub groups are there? List as many as you can.

E N D
Warm Up Questions • Do RFEPs count in the EL subgroup for API? • How many “points” is a proficient score worth? • Does a passing score on the CAHSEE equal a proficient score? • How many different significant sub groups are there? List as many as you can. • Students moving from FBB to B increases AYP T or F • You can meet AYP through Safe Harbor? • What does CAPA stand for? • Who is eligible to take the CMA? • Students with testing modifications scores are not considered valid T or F • Do students who enroll after Thanksgiving count in your school’s scores? • What tests count towards AYP at the high school level? • Do all schools who do not meet AYP targets fall into Program Improvement? • What does a similar school rank of 5 represent?
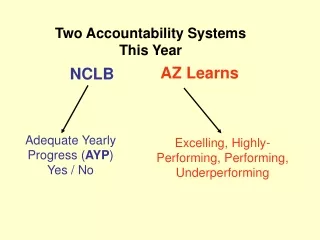
California and Federal Accountability Systems • Two systems that convert test results into different measures of academic performance • California measure: the Academic Performance Index (API) looks at growth in school performance • Federal measure: Adequate Yearly Progress (AYP) looks at the percentage of students proficient or above
Numerically Significant Subgroups • Defined in the same manner for both the state and federal accountability systems • Definition • 100 students or more with valid STAR Program Scores OR • 50 students with valid STAR Program Scores that make up at least 15% of the total number of students tested
Numerically Significant Subgroups • Participation rate • Based on enrollment on the first day of testing • Percent proficient • Based on the number of valid test scores • Schools or LEAs with fewer than 100 students will not have any numerically significant subgroups
Numerically Significant Subgroups • All major racial/ethnic groups • Socioeconomically disadvantaged • Defined as participating in the Free or Reduced Price Lunch Program or neither parent has a high school diploma • English Learners • An English Learner based on the results of the CELDT or • A reclassified English-Proficient (RFEP) student who has not scored at proficient level or above in CST-ELA more than 3 times since being reclassified
Numerically Significant Subgroups • Students with disabilities • A student who receives special education services, has a valid disability code or • Previously identified as SWD but who is no longer receiving services for two years after exiting
What Is the API? • Created by the Public Schools Accountability Act (PSAA) in 1999 • Single number ranges from 200 - 1000 • Based on student performance on statewide assessments across multiple subject areas • Requires subgroup accountability to address achievement gaps • Used to rank schools
What Is the API? • Cross-sectional look at student achievement - does not track individual student progress • Based on the performance of the students at the school who were enrolled for a “full academic year” (Mobility tracking) • The API from one year is compared to the API from the prior year to measure growth
API Reporting Cycle • New tests are added or new weights are given to the tests with the Base API • Within one reporting cycle, the Base and Growth APIs must have the same tests with the same weights – only valid way to compare results
What Assessments Are Used in the API? • California Standards Tests (CSTs) • English-language arts (grades 2-11) • Mathematics (grades 2-11) • Science (grades 5, 8, 9-11) • History/Social Science • Grade 8 • Grade 11 (U.S. History) • Grades 9-11 (world history) • California Modified Assessment • ELA 3-9th) and Math 3-7 and Algebra , Science 5, 8, 10 • California Alternative Performance Assessment • ELA and Math 2-11 and Science 5, 8, 10 • California High School Exit Exam (CAHSEE) • 10th grade ELA and Math • 11th and 12th (if passed anytime during school year)
API Ranks • Required by EC Section 52056 • Statewide Rank • Establishes a ranking of schools from highest to lowest • Calculated separately by school type • Compares to all schools statewide with same school type • Similar School Rank • Calculated separately by school type • Compares a school to 100 other schools that are similar on key variables
API Ranks • Ranks are established by deciles (10 equal groups) • Range from 1 to 10 • 1 is low • 10 is high • Ranks improve when the API score increases • Dependent upon API increases of other schools statewide
Similar Schools Ranks • Obtain demographic data, Base APIs, and school type • Calculate a School Characteristics Index (SCI) for each school based on more than 20 variables • Rank SCIs from high to low separately by school type. Identify 50 schools with SCIs just above and 50 schools with SCIs just below the “target” school • Sort by APIs and determine similar schools rank
Similar Schools Ranks • Rank 1 means the school is comparable to the lowest 10 schools of the 100 similar schools • Rank 10 means the school is better than at least 90 of the 100 similar schools • Schools often do not “look” like my school • Based on similar challenges
Uses of the API • Measure performance of schools and determine improvement • Determine eligibility for awards and interventions programs • Charter school renewal • Component of federal AYP system
What Is AYP? • Federal accountability requirement enacted by No Child Left Behind (2001) • Methodology must be annually approved by the U.S. Department of Education • Must meet annual targets that increase over time • Goal is 100% of students proficient in ELA and mathematics by 2013-2014 • Annual determination for schools and LEAs
California’s Definition of AYP • Participation rate • ELA and math • Percent proficient (Annual Measurable Objectives (AMOs) • ELA and math • API as an additional indicator • Graduation rate • High schools only
A school may potentially have 46 different ways to miss AYP. True
AYP Components • Participation rate • Up to 11 different student subgroups • Two content areas • 22 ways • Percent proficient • Up to 11 different student subgroups • Two content areas • 22 ways • API • High school graduation rate
Which Assessments Are Used for AYP? • Elementary and Middle Schools • CSTs • CMA • CAPA • High Schools (grade 10 only) • CAHSEE • CAPA Participation rate and percent proficient calculations based on CST = California Standards Test CAPA = California Alternate Performance Assessment CAHSEE = California High School Exit Exam
Which Assessments Are Used for AYP? • High schools • Based only on Grade 10 CAHSEE results • Student enrollment and performance will differ if you compare STAR, API, and AYP results
Participation Rate • Must be 95% or greater • In ELA and math • For the school or LEA and all numerically significant subgroups • Students tested with modification are not counted as participating • Numerically significant subgroups based on enrollment on the first day of testing
Percent Proficient • Each state can set their own definition of “proficient” • Also called Annual Measurable Objectives (AMOs) • Annual target by school type • ELA and math
Percent Proficient • Targets are the same for • LEAs • Schools • Subgroups • Numerically significant subgroups are based on the number of valid test scores
Other AYP Indicators • API • Schools must grow by at least one point or have an API score at or above the annual target (680) • Graduation Rate • For high schools only • Must show growth or be above the annual target
Alternative Methods • Two-year average • Averages results over two years • Safe Harbor • The percent of students scoring below proficient decreased by 10%
Identifying Schools for PI • Only schools receiving Title I funding • Schools are identified after missing AYP for two consecutive years • In the same content area (ELA or math), or • On the same indicator (API or graduation rate)
2010 2009 Met all criteria except percent proficient for English Learners in ELA Met all criteria except participation for Hispanic in ELA Identified for PI: The school missed the same content area for two consecutive years Identifying Schools for PIExample
2010 2009 Met all criteria except percent proficient for African Americans in ELA Met all criteria except percent proficient for African Americans in math Not Identified for PI: The school did not miss in the same content area for two consecutive years Identifying Schools for PIExample
Differences in the Consequences • State • Schools participating in state intervention programs are subject to sanctions if API growth requirements are not met • School Assistance and Intervention Team (SAIT) • Federal • Schools and LEAs receiving Title I funding are identified for interventions if they fail to make AYP for two consecutive years • Program Improvement
Differences in Which Assessments Are Included • State • Includes results from the CSTs, the CAHSEE, the CMA and the CAPA • Includes ELA, math, science, and history/social science • Federal • Includes results from the CSTs, and CAPA for grades 2-8; CMAs for grades 3-8; CAHSEE and CAPA for grade 10 • Includes only ELA and math
Differences in Which Students Are Included • State • STAR: Includes results from all students who took the assessments • API: Excludes students not enrolled for a full academic year; includes assessment results from grades 2-11 • Federal • Excludes students not enrolled for a full academic year • Excludes English Learners enrolled in U.S. schools less than a year • Includes CAHSEE results for grade 10 only
State and Federal Accountability • API: California State Accountability • API scale: 200 – 1000 • API scores based on proficiency levels • AYP: Federal Accountability • Determined by percent of students scoring proficient or advanced • 2011 Targets • Elem & Middle Schools: ELA = 67.6%; Math = 68.5% • High Schools: ELA = 66.7% ; Math = 66.1%