Download
1 / 32
360 likes | 778 Views
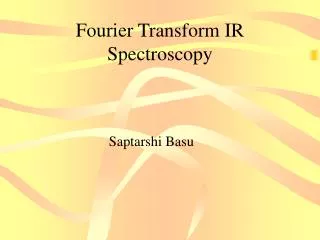
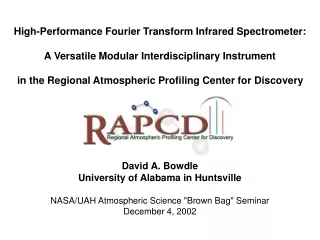
Fourier Transform Infrared Spectroscopy . Moving mirror. IR source. Static mirror. Beamsplitter. Michelson Interferometer. Simplest interferometer layout Beamsplitter consists of a thin reflective layer (Si, Ge) supported between two windows

E N D
FourierTransformInfraredSpectroscopy Introduction to FTIR
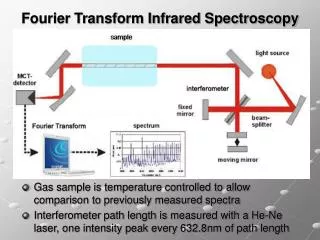
Moving mirror IR source Static mirror Beamsplitter Michelson Interferometer • Simplest interferometer layout • Beamsplitter consists of a thin reflective layer (Si, Ge) supported between two windows • In an ideal case 50% of each beam (regardless of direction) is reflected and 50% is transmitted through the beamsplitter • Beams reflected from the moving and static mirrors interfere when they meet at the beamsplitter • When the moving mirror shifts in either direction, the distance travelled by yellow beam becomes different from the distance travelled by the red beam (optical path difference, OPD) Introduction to FTIR
Mirror movement and interference Interference is constructive when OPD = n × l or when mirror has shifted by (n/2) × l Interference is destructive when OPD = (n/2)× l or when mirror has shifted by (n/4) × l Interference signal as function of time or as function of OPD is sinusoidal as long as mirror moves at constant speed
Fourier Transformation • Measured interference signal as function of position I(x) is a sine or cosine function if the interfering waves have exactly the same wavelength (frequency) • Frequency spectrum I(f) can be computed from I(x) using Fourier transformation. If interference signal is sine or cosine form, the frequency spectrum contains a Diracin delta function (infinitely narrow pulse, surface area below curve = 1) • Complicated interference signals may be expressed as a series of sine and cosine terms Intensity Intensity Fourier Transform Pair OPD / cm Wavenumber / cm-1 Introduction to FTIR
From an interferogram to a spectrum Spectrum consisting of three discrete frequencies E( ) SpectrometerIR source Continuous emission FT Each frequency contributes a cosine wave to the interferogram Observed interferogram of wide band of frequencies FT OPD 0 Observed interferogram with centerburst OPD OPD 0 Introduction to FTIR
950 1950 2950 3950 IR and Laser Interferograms A • IR interferogram is recorded after the IR beam passes through the interferometer and sample cell • IR interferogram contains the absorption of sample gas • Laser interferogram is produced by a Helium-Neon laser beam travelling through the interferometer into a special detector • Laser interferogram is a nearly ideal cosine wave • Laser interferogram tells the position of moving mirror with excellent accuracy IR-interferogram Laser-interferogram OPD x =632.8nm Introduction to FTIR
Recording an interferogram • Laser interferogram signal is used to digitize the IR-interferogram • Single mode HeNe-laser provides a constant wavelength output at 632.8 nm • Accurate and precise digitization interval provides high wavelength accuracy in the spectrum • The data points for IR interferogram are recorded every time the mirror has moved forward by one HeNe laser wavelength Infrared source Helium-Neon laser Introduction to FTIR
Optical path difference Recording an interferogram • The digitized IR-interferogram (an XY- table) is transmitted to computer where the Fast Fourier Transform (FFT) algorithm computes the spectrum (number of points has to be 2n ) Infrared source Infrared source Helium-Neon laser Helium-Neon laser 0 -L Introduction to FTIR
Measurement Sequence Transmittance spectrum Background Interferogram with N2 Single beam sample spectrum Absorbance spectrum Interferogram with sample • Transmittance spectrum is a single beam sample divided by background • Absorbance spectrum = negative logarithm of transmittance Introduction to FTIR
Resolution and Interferogram truncation Cutoff points at – L, L (cm) Resolution is limited by interferogram truncation at –L and +L. A spectrum contains only as many data points as the interferogram. Line shape due to truncation (boxcar) is a sinc function and its width is: One can add data points to spectrum by interpolation, but it will not add information or make the sinc function narrower. Interpolation is conventionally achieved by filling zeroes to the truncated interferogram outside the interval [-L,+L]. Increasing true spectral resolution requires increasing the distance travelled by the mirrors. Sinc(x) = x / sin( x) Introduction to FTIR
Interference pattern Beam of light exiting a finite aperture contains an interference pattern. Image of the light source on the detector in an FTIR spectrometer is typically a disk (circular windows) The strongest intensity maximum is at the middle of the disk, weaker maxima are observed as rings surrounding the central maximum (Airy disk) Top: approximate representation Bottom: interference pattern in a laser beam exiting a Michelson interferometer Introduction to FTIR
Aperture broadening 2 is the size of the image of light source on the collimating mirror or lens Rays coming from different parts of the light source travel through different paths as their varies between 0 ... maxand their OPD is different. This causes spectral line broadening: S = light source Aperture broadening adds a rectangle shaped contribution to the overall line shape
Aperture broadening and interference Spectral lines are broadened if the aperture is so wide that interference rings are included (top) Limiting the aperture to only central maximum makes the lines narrow but cuts off the light incident on detector significantly – lower SNR Introduction to FTIR
Optimal Resolution Aperture must usually be adjusted when resolution is changed. Aperture should not be so wide that it causes more broadening than truncation. On the other hand the aperture should not be so small to cut off signal significantly. The optimal truncation and aperture width are found when the two broadening components are equal.
mixture: 1 cm-1 residual: 1 cm-1 mixture: 8 cm-1 residual: 8 cm-1 Signal to noise ratio and resolution 1 cm-1 • Increasing aperture increases SNR at the expense of resolution • Co-adding several interferogram scans increases SNR at the expense of response time (SNR proportional to square root of number of scans) • Lower resolution gives more scans per second due to short mirror movement and more signal due to wider aperture Absorbance (a.u.) 8 cm-1 3000 2800 2600 2400 2200 2000 1800 1600 1400 1200 1000 800 Wavenumber cm-1 Figure adapted from: Instrumental Resolution Considerations for Fourier Transform Gas-Phase Spectroscopy. Applied Spectroscopy. Volume 51, Number 8, 1997. Introduction to FTIR
0,5 high resolution 0,4 0,3 8 cm-1 Absorbance 0,2 0,1 0 0 2000 4000 6000 8000 10000 12000 concentration (ppm) Resolution and Lambert-Beer Law Introduction to FTIR
Lambertin-Beer law for Polychromatic radiation The equation 4 does not indicate a linear absorbance/concentration relationship. The more epsilons differ from each other, the more nonlinear the response becomes. Non-linearity due to finite resolution can be modelled mathematically Introduction to FTIR
Interferogrammi ja resoluutio • Matalalla resoluutiolla (interferogrammin katkaisu keskikohdan läheltä) havaitaan pelkkä rotaatiohienorakenteen verhokäyrä • Yksittäiset rotaatioviivat tulevat näkyviin kun resoluutio paranee viivanleveyttä paremmaksi • Interferogrammissa ei ole informaatiosisältöä verhokäyrää vastaavan osan ( 0 … 0.1 cm) ja rotaatioviivoja vastaavan osan (1.0 cm ) välillä • Katkaisukohta pitää valita käyttötarkoituksen mukaan Introduction to FTIR
Liikkuva peili Lähde Staattinen peili Säteenjakaja Miksi ei Michelsonin interferometri ? • Yksinkertaistettu malli oikealla ei toimi käytännössä • Lähteeltä tulevan säteen pitää olla tasoaalto säteenjakajalla • Lähteeltä tulevan säteen pitää tulla rajatusta apertuurista • Säteen täytyy fokusoitua interferometrin jälkeen • tarvitaan optiikkaa lähteelle ja detektorille • Peilien täytyy olla 90° kulmassa säteeseen nähden (myös liikkeessä) • Käytännössä interferometrit ovat joko modifioituja Michelsoneja tai kokonaan muun tyyppisiä, joissa kulmien arvot eivät ole niin kriittisiä Introduction to FTIR
Interferometrissä käytettäviä optisia materiaaleja Ikkunat ja linssit: Lasi ei läpäise IR-alueella Sopivat materiaalit yleensä suoloja Yhtä hyvää materiaalia ei ole Haitat: Absorbanssi ainakin osassa IR-aluetta Korkeasta taitekertoimesta johtuvat heijastushäviöt Vesiliukoisuus Naarmuuntumisherkkyys Myrkyllisyys - Yleensä suositaan peilejä linssien sijasta Peilit: lasia tai metallia, kultapinnoite Kultapinnan heijastavuus keski-IR –alueella on noin 98% tai parempi Useista peräkkäisistä heijastuksista aiheutuu silti kymmenien prosenttien hävikki Introduction to FTIR
Interferometrissä käytettäviä peilejä • Paraboloidipeili: • Kollimoi pistelähteestä tulevan säteen yhdensuuntaiseksi (valonlähteestä interferometriin) • fokusoi yhdensuuntaisen säteen polttopisteeseen (interferometristä näytteeseen) • Ellipsoidipeili: • Fokusoi säteen yhdestä polttopisteestä toiseen (näytteestä detektoriin) • Tasopeilit: yhdensuuntaisen säteen siirto • Pallopeilit: moniheijastuskyvetin sisällä Introduction to FTIR
Moniheijastuskyvetti 10 14 6 18 22 2 Sisään Ulos 4 20 8 16 12 Parittomat heijastukset vastakkaisella peilillä. Useita kertoja heijastunut säde silminnähden heikko Introduction to FTIR
Sample cells and optical path length Different path lengths for different measurement ranges High Sensitivity (Multipass) Sample CellV = 0.4 l L = 60 … 980 cm T90< 10 sec (4 lpm) L = 9.8 meter c = 10 ppm A = 0.0047 a.u L = 2.5 meter c = 39 ppm A = 0.0047 a.u L = 10 centimeter c = 980 ppm A = 0.0047 a.u Single pass cellV = 0.013 … 0.031 l L = 1, 4, or 10 cm T90 < 1 sec (4 lpm) L = 4 centimeter c = 2450 ppm A = 0.0047 a.u Introduction to FTIR
IR-detektoreita DTGS ja muut pyroelektriset ilmaisimet perustuvat ferroelektrisen materiaalin polarisaation muutokseen kun lämpötila muuttuu – voidaan mitata joko jännitteenä tai virtana kun detektori asetetaan kondensaattorin elektrodien väliin • TOIMIVAT HUONEENLÄMPÖTILASSA • - LAAJA VASTEALUE - 12500 – 350 cm-1 • HYVÄ LINEAARISUUSALUE – 0-1 ASB • HIDAS / MELKO EPÄHERKKÄ • DTGS = DEUTEROITU TRIGLYSIINISULFAATTI Introduction to FTIR
IR-detektoreita Puolijohdeilmaisimissa IR-säteily siirtää elektroneja valenssivyöstä johtavuusvyöhön. Vöiden välinen energiaero rajoittaa pienintä fotonin energiaa, joka aikaansaa siirtymän (detektio) • JÄÄHDYTETTY (77 k) • ERITTÄIN HYVÄ S/N • NOPEA VASTE • KAPEAHKO VASTEALUE – 11700 – 600 cm-1 • KAPEAHKO LINEAARISUUSALUE – 0-0.7 ABS • MCT = elohopea – kadmium -telluridi Introduction to FTIR
Quantum Detectors Riippuen MCT-puolijohteen seossuhteesta (Hg:Cd) voidaan valita pitkäaaltoisempaan valoon reagoivia detektoreita (pienempi ero valenssi- ja johtavuusvyön välillä) Parempi vaste pitkillä aallonpituuksilla johtaa huonompaan maksimiherkkyyteen kT-energiajakauman takia elektroneita pääsee johtavuusvyöhön jos detektoria ei jäähdytetä – yleensä 77 K BLIP = background limited IR performance Introduction to FTIR
Quantum Detectors • MCT voidaan kytkeä eri tavoin: • valon indusoima jännite (photovoltaic) • Valon indusoima johtokyvyn muutos (photoconductive) • PV – kytketty detektori on herkempi mutta sitä ei voi käyttää ollenkaan ilman jäähdytystä (biasvirta riittää huoneenlämmössä rikkomaan detektorin) • PC-kytkettyä detektoria voi käyttää korkeammissa lämpötiloissa Introduction to FTIR
Quantum Detectors Ylempi kuvaaja: nestetyppijäähdytetty PV-detektori Alempi kuvaaja: Peltier-jäähdytetty PC-detektori Pienempi elementti on herkempi, säde fokusoitava tarkasti detektorille Mutta: liian suuri pintakirkkaus voi saturoida detektorin Introduction to FTIR
Yksinkertainen teollisuus-FTIR • Yksi valonlähde • Yksi detektori • Yksi näytekyvetti • Kiinteästi asetettu apertuuri • Edut: • Stabiili (mahdollisimman vähän säädettäviä osia) • Tehtäväänsä optimoitu (matalan resoluution mittauksiin korkealla SNR:llä) Introduction to FTIR
Laboratorio - FTIR • Monta lähdettä (NIR, MIR, 2 ulkoista) • Monta detektoria (MCT, DLaTGS, + ulkoiset) • Monikäyttöinen näytetila • Säädettävä apertuuri • Edut: • Monikäyttöinen • Korkea resoluutio Introduction to FTIR


![Fourier transform infrared spectroscopy[FTIR]](https://cdn1.slideserve.com/2743434/fourier-transform-infrared-spectroscopy-ftir-dt.jpg)