Download
1 / 17
180 likes | 324 Views
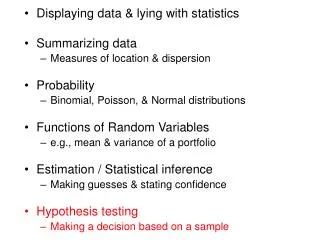
Displaying data & lying with statistics Summarizing data Measures of location & dispersion Probability Binomial, Poisson, & Normal distributions Functions of Random Variables e.g., mean & variance of a portfolio Estimation / Statistical inference Making guesses & stating confidence

E N D
Displaying data & lying with statistics • Summarizing data • Measures of location & dispersion • Probability • Binomial, Poisson, & Normal distributions • Functions of Random Variables • e.g., mean & variance of a portfolio • Estimation / Statistical inference • Making guesses & stating confidence • Hypothesis testing • Making a decision based on a sample
A true story Dear Abby, You wrote in your column that a woman is pregnant for 266 days. Who said so? I carried my baby for ten months and five days, and there is no doubt about it because I know the exact date my baby was conceived. My husband is in the Navy and it couldn’t have possibly been conceived any other time because I saw him only once for an hour, and I didn’t see him again until the day before the baby was born. I don’t drink or run around, and there is no way this baby isn’t his, so please print a retraction about the 266-day carrying time because otherwise I am in a lot of trouble. ---signed, San Diego Reader
Definitions Simple specifies a single value for Hypothesis: a population parameter examples: p = .2 m = 100 ml Composite specifies a range of values Hypothesis: for a population parameter examples: p > .2 m¹ 100 ml
Bottle Filling Example -- two simple hypotheses H0: Machine fills 100 ml per bottle HA: Machine fills 106 ml per bottle Null Alternative s= 15 ml (known) n = 36 observe X
Null Alternative Machine really fills 100 ml Machine really fills 106 ml û Conclude that machine fills 100 ml ü Conclude that machine fills 106 ml û ü
Type I and Type II Errors a :This is the probability of making a Type I error, assuming that H0 is true. i.e., the probability of accepting the alternative when the null is true. b: This is the probability of making a Type II error, assuming that HA is true. i.e., the probability of accepting the null when the alternative is true.
Decision Rule Bottle Filling Accept HO Reject HO Distribution of X assuming H0 is true Distribution of X assuming HA is true 104.1
Type I Error a: Rejecting null hypothesis when it is true Type II Error b: Failure to reject null hypothesis when it is false Condition
Three Key Concepts • Fundamental trade-off between a and b. • Can reduce both a and b simultaneously by increasing sample size. • Ideally, set up null hypothesis so that Type I error is more important.
A Societal Decision Really Guilty Really Innocent ü Convict ü Let Go
Drug Safety Drug Harmful Drug Safe Do not approve for sale ü ü Approve for sale
Bottle Filling H0: m = 100 HA: m > 100 n = 36 s = 15 a = 0.05 One-sided Test to the Right Accept HO Distribution of X assuming H0 is true Reject HO z ?
Bottle Filling H0: m = 100 HA: m < 100 n = 36 s = 15 a = 0.05 One-sided Test to the Left Reject HO Distribution of X assuming H0 is true Accept HO z ?
Bottle Filling H0: m = 100 HA: m¹ 100 n = 36 s = 15 a = 0.05 Two-sided Test Accept HO Reject HO Reject HO z ? ?
Bottle Filling H0: m = 100 HA: m¹ 100 n = 16 s = 12 a = 0.05 Two-sided Test: Small Sample Accept HO Reject HO Reject HO t ? ?
Determine the Test Statistic ?? s known n ³ 30 s unknown s known PopN ~ Normal s unknown n < 30 PopN ~ “Not Normal”
Hypothesis Testing Mechanics (1) Set up hypotheses, for example: H0: m = 100 HA: m > 100 (or m < 100, or m¹ 100) (2) Determine the test statistic. Depends on sample size and whether s is known. (3) Decide on a and specify a rejection region. (4) Collect data, compute the sample mean and, if necessary, the sample standard deviation. (5) Reject H0 if the observed z, t, or sample mean falls in the rejection region.