Download

1 / 48
570 likes | 712 Views
Explore the history of epidemiology, key concepts, measures of disease, effects, and study designs for public health research. Learn about controlling health problems and implications in the modern day.

E N D
Introduction to Epidemiology • Martin van der Esch, PhD
The Plague, 1330 Spread via transport routes Asia, North Africa, Europe, and the Middle East Transmission via rats and fleas Big impact
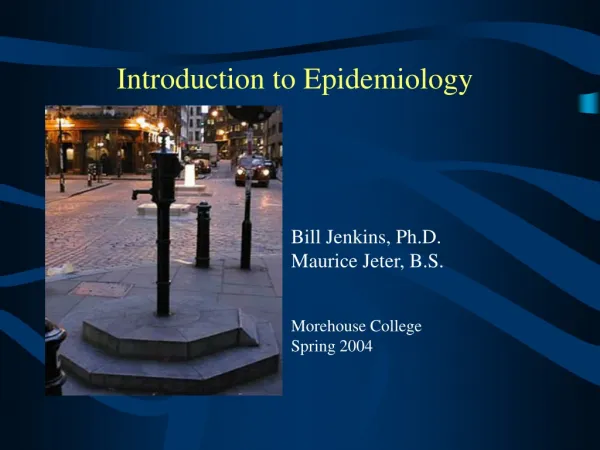
John Snow (1813-1858) Cholera deaths in London in 1854 Minor Health Care & Science The Geographical Journal Minor Health Care & Science
Modern plagues, HIV, SARS..
Defining Epidemiology • “The study of the distribution and determinants of health related states and events in populations, and the application of this study to control health problems.” • John M Last Dictionary of Epidemiology
Epidemiological function • Z=f(Di) • • Z=fmi(D|Ci) This is the primary relation: DV IV The disease is a function (amount of risk) of the determinant smoking. The function to the disease can be confounded by the determinant drinking. The strength of the function is dependent upon sex. D = Determinant Z = Disease Bouter, L.M. et al: 2011
What are the central variabels in the research? independable variable (‘cause’) dependable variable (‘consequence’) riskfactor determinant central determinant Exposition outcome disease central variable
Introductory Epidemiology • Measures of Disease • Measures of Effect (of a risk factor) • Study Designs for Measuring Effects • Dealing with random error • Dealing with confounding • Dealing with bias • Biostatistical analyses for analyzing data
Measures of Disease • Incidence • Cumulative Incidence • Incidence Density • Prevalence • Point Prevalence • Period Prevalence • Survivorship (time to event, such as mortality)
Measures of Covariates (risk factors) • Binary: gender, smoker, circumcised • Nominal/Categorical: geographic region • Continuous: birth weight, T-cell count • Ordinal: education, socioeconomic status (SES)
Measures of Effect • Compare measure of disease across levels/values of risk factors • Relative RiskRatio of rates or proportions • Prevalence Ratio • Cum. Incidence Ratio • Incidence Density Ratio • Odds Ratio • Attributable RiskSubtract rates or proportions
Contingency Tables: Relative Risk (RR) Cumulative Incidence Ratio is the ratio of cumulative incidence in the exposed population divided by the cumulative incidence in the unexposed population. CIR < 1 means exposure correlates with reduced risk of disease CIR > 1 means exposure correlates with increased risk of disease
Epidemiologic Studies • Descriptive Epidemiology • Baseline data on distribution of disease • Surveillance • Analytic Epidemiology – Measure Effect • Prospective Cohort Studies • Cross-sectional Studies • Retrospective Case-Control Studies • Ecologic Studies • Randomized Controlled Trials Observational Experimental
Cohort Studies • Follow a selected population through time • Establishes temporal relationships • Can measure incidence • Takes lots of resources, money, & time! • Poor design for rare diseases.
Cross-Sectional Studies • Snapshot of diseases & risk factors. • Cannot establish temporal relationship. • Relatively cheap & easy. • Population must be large to study rare disease • Not great for diseases of short duration. Why?
Case-Control Studies • Compare diseased individuals to chosen controls. • Quality of study depends entirely on how controls are chosen. • Good for rare diseases. • Relatively cheap & quick.
Case Control Studies: Odds Ratios Controls: Number chosen by researcher. Odds ratio is the ratio of odds in the diseased population divided by the odds in the non-diseased population. OR < 1 means exposure correlates with reduced risk of disease OR > 1 means exposure correlates with increased risk of disease
Randomized Controlled Trials • Experimental or Intervention Studies • Establishes temporal relationships • Addresses confounding (more to come)
Introductory Epidemiology • Measures of Disease • Measures of Effect (of a risk factor) • Study Designs for Measuring Effects • Dealing with random error • Dealing with biasDealing with confounding • Biostatistical analyses for analyzing data
Random Error • How many people must be in a study for the measure of effect to believable? • Statistical Approach:Assign probabilities to our findings being a product of random error rather than a real phenomenon.
Bias Difference between observed value and true value due to all causes other than random error. Bias does not go away with greater sample size! Bias must be dealt with during study design!
Selection Bias Error due to systematic differences between those who take part in the study and those who do not. John Last, Dictionary of Epidemiology InformationBias A flaw in measuring exposure or outcome data that results in different quality (accuracy) of information between comparison groups. John Last, Dictionary of Epidemiology
Confounding What if some of the study population were much younger than others? HIV Status Literacy
Confounding 6-15 year olds: Literacy = 300/1200 = 25% 16-24 year olds: Literacy = 700/800 = 87.5%
Confounding Age CONFOUNDING HIV Status Literacy
What do Introductory Epidemiology courses teach? • Measures of Disease • Measures of Effect (of a risk factor) • Study Designs for Measuring Effects • Dealing with random error • Dealing with biasDealing with confounding • Biostatistical analyses for analyzing data
Biostatistical Analyses • Testing null hypothesis: • Significance testing with continuous data • Significance testing with dichotomous/ordinal data • Generalized Linear Models • Linear Regression (simple – multi) • Logistic Regression • Poisson Regression • Survival Analysis
Quantatative Research: Counting & MeasuringVariables & RelationsDeduction Characteristics Differences & Simularities Testing & estimating Correlations (associations) Causal relations X Y Description • Explaining • Cause of Y • Prediction- Consequence of X Minor Science
Systems Approach:Explicitly model multiple mechanisms to understand their interactions • Account for bias and random error to find correlations that may imply causality Observational Models Longitudinal Models • Often the first step to assessing relationships • Links observed relationships at different scales • Assume independence of individuals (at some scale) • Explicitly focuses on dependence of individuals By developing longitudinal models in a probabilistic framework we can account for dependence, random error, and bias while linking patterns at multiple scales
Questions in Epidemiology • Is inactivity of daily living positively associated with muscle weakness and the risk of knee osteoarthritis? Cross-sectional Longitudinal • Based on increased knee osteoarthritis risk due to muscle weakness, how much knee OA patients should we expect in five years given the increase in inactivity in older people?
Clinical themes in epidemiology • Etiology • Prevention • Treatment • Diagnostics • Prognosis
Themes in epidemiology Etiology (RISK, Harm) - determining risks of disease - causal relations Prevention/Therapy (Intervention) - efficacy, effectiveness, efficiency of treatment Diagnosis/screening - presence, nature, severity of disease Prognosis - predicting course and outcome of disease - time
Model for researching disease Healthy Etiology Risk factors of disease Prevention Diagnosis Diseased Therapy Effectiveness of interventions Prognosis Prognostic factors of outcome Therapy Outcome of disease
Course of disease & epidemiology Epidemiological research; Bouter, L. et al; 2003
Tutorial 1 introduction epidemiology • Formulate a question in • ‘Quantitative research’
Translate the clinical problem into an answerable, focused and well-formulated question (PICO) P I C O Therapy DOMAIN Diagnosis Prognosis Etiology, Harm Patient/ Population/ Problem Intervention Comparison/ Control Outcome PICO(T) : T= Timeframe PECO(T) : E= Exposure PIO(T) : Epidemiological study without comparison/control Not all elements have to be included in every research question!
Research question is step in scientific research Zielhuis;, G.A.; Handleiding in medisch-wetenschappelijk onderzoek: blz. 19-40
Task 1: "Research Design - Experiment" • Construct, according to the basic scheme of RCT, from the lecture an RCT described below in the clinical problem. • MEASURES AGAINST PRESSURE ULCERS • Nurses are concerned with the consequences of health problems, especially those that the patient can not prevent themselves. Pain, fear, anxiety, and immobility are examples of such problems that belong to the domain of nursing. • Sometimes the demarcation of the field of medicine is not clear. Bedsores and pressure ulcers are two examples. Nurses have washing, blow drying, position changes, water beds and sheepskins at their disposal for these conditions. Doctors use drugs locally, referral to surgery for severe pressure ulcers, and try through nutritional remedies to increase patient resistance and regenerative capacity. • Gerben, a newly graduated medical doctor, had an apprenticeship experience in a nursing home. Marleen is a nurse and was nursing in the same department as Gerben. Both were impressed by the high prevalence of pressure ulcers. Gerben thinks that high-dose vitamin C will have a beneficial effect on the healing capacity of pressure ulcers. Marleen thinks ultrasound therapy has a more positive effect. Incidentally, one does not exclude the other, they think, and there may be quite a number of factors that are important to the healing of ulcers. They decide to make a research design in which both hypotheses are examined.