Download
1 / 33
330 likes | 519 Views
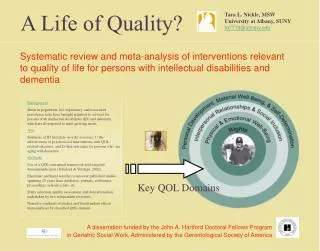
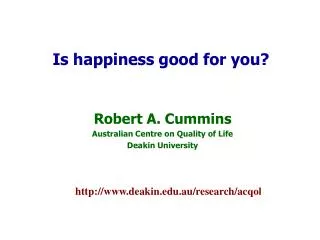
Happiness and Public Policy. Robert A. Cummins Australian Centre on Quality of Life Deakin University. http://www.deakin.edu.au/research/acqol. The traditional route to happiness is money So the best public policy for increasing happiness, according to Economists

E N D
Happiness and Public Policy Robert A. Cummins Australian Centre on Quality of Life Deakin University http://www.deakin.edu.au/research/acqol
The traditional route to happiness is money So the best public policy for increasing happiness, according to Economists is to make populations richer So, around the world, prior to 1970’s Quality of Life = GDP.
550 500 450 400 GDP is held as a percent of its 1958 value 350 300 250 200 150 100 50 0 1958 1960 1962 1964 1966 1970 1974 1976 1978 1980 1982 1987 Year Economic growth and Subjective Wellbeing in Japan Deflated GDP/capita (Diener & Biswas-Diener, 2002)
550 500 450 400 GDP is held as a percent of its 1958 value 350 300 250 200 150 100 50 0 1958 1960 1962 1964 1966 1970 1974 1976 1978 1980 1982 1987 Year Increasing GDP does NOT = increasing happiness! Deflated GDP/capita Life satisfaction is the actual value for each year Life Satisfaction (Diener & Biswas-Diener, 2002)
Objective Conditions e.g. Physical health Subjective Perceptions e.g. Satisfaction with health Subjective Wellbeing [happiness] Objective QOL Quality of Life ?
Subjective Wellbeing • A positive state of mind that involves the whole life experience How do we measure it?
“How satisfied are you with your life as a whole”? This can be broken down in a number of Life Domains How satisfied are you with your----- [life domain]? How can we recognize the MINIMUM number of life domains?
“How satisfied are you with your life as a whole?” Domains: all must contribute unique variance Standard of living Health Achieving in life Relationships Safety Community connectedness Future security Spirituality/Religion β β β β β β β β
Personal Wellbeing Index How satisfied are you with your-----? • Standard of living • Health • Achieving in life • Relationships • Safety • Community connectedness • Future security • Spirituality/Religion
How satisfied are you with your ----? [Jones and Thurstone ,1955] 11-point, end-defined scale Completely Dissatisfied Completely Satisfied Mixed
We code all data to lie on a range from Complete dissatisfaction Complete satisfaction 0 100
Why is subjective wellbeing important?Positive emotions build a range of personal resources as: Physical resources (health, longevity) Social resources (friendliness, social capital) Intellectual resources (intellectual curiosity, expert knowledge,) Psychological resources (resilience, optimism, creativity)
In 2000 we linked with our industry partner, Australian Unity Purpose:to create a quarterly index of subjective wellbeing for the Australian population. As an alternative to the traditional economic indicators such as GDP
This is a world first • No other country has a quarterly wellbeing index • (but others are going to follow)
The International Wellbeing Group 48 Countries and Provinces
The Australian Unity Wellbeing Index Surveys • Geographically representative sample • N = 2,000 • Telephone interview • #1: April 2001 • ------------ • #17: April 2007
77 >S11 76 >S2, S4, S5 Scores above this line are 75 significantly higher than S1 Strength of satisfaction 74 73 72 Major events 1 2 3 4 5 6 8 7 preceding survey Survey S7 Jun 2003 S5 Nov 2002 S9 Nov 2003 S3 Mar 2002 S6 Mar 2003 S4 Aug 2002 S8 Aug 2003 S2 Sept 2001 S14 Oct 2005 S16 Oct 2006 S10 Feb 2004 S11 May 2004 S13 May 2005 S15 May 2006 S12 Aug 2004 S17 Apr 2007 S1 Apr 2001 Date PWI 2001 - 2007 Key: 1 = September 11 2 = Bali Bombing 3 = Pre-Iraq War 4 = Hussein Deposed 5 = Athens Olympic 6 = Asian Tsunami 7 = Second Bali Bombing 8 = New Industrial Relations Laws
100 90 80 76.4 73.4 70 Subjective Wellbeing Mean = 74.9 60 50 SD = 0.8 40 30 20 10 0 Normative rangeusing survey mean scores as data (N=17) Very satisfied Very dissatisfied
Why is subjective wellbeing held so steady? • Homeostasis • Just like we hold body temperature steady • Subjective wellbeing homeostasis
90 60 Each person has a set-point for their subjective wellbeing. These set-points lie between 60 and 90 Range for individual set-points Set-points are always POSITIVE ie above 50
The average set-point is 75. 90 Range For individual set-points 75 [The set-point for the average person ] 60
When nothing much is happening to them, people rate how they feel about their life in terms of their set-point for SWB Each person has a set-point for their subjective wellbeing. 90 The average set-point 75 60 Time
Homeostasis can fail Overwhelming Negative Challenges Subjective wellbeing • The result of subjective wellbeing loss is depression
Homeostasis can be defeated by: Poverty Chronic pain (arthritis) Chronic stress (carers) Lack of intimacy Living conditions (street-kids) Incarceration (prisoners)
X Subjective wellbeing Challenging situations External resources (eg. relationships, money) Internal resources (eg. Finding meaning for the bad event) But people are RESILIENT ! This is why there is normally such a poor relationship between subjective Wellbeing and the objective QOL indicators
90 60 Persistent homeostatic failure[demands chronically exceed resources] Subjective wellbeing 40 Depression Time
How can these subjective social indicators be used to enhance population happiness? • They can tell us about when additional resources are, and are not, likely to benefit SWB
Does greater wealth always benefit SWB? NO The effect of both on SWB is not linear (ie more is not necessarily better) BUT The relationship of both with SWB can be understood via homeostasis
Income and subjective wellbeing 81 Total N ≈ 30,000 80 79.2 * 79 78.3 78.0 * 78 76.5 77 Subjective wellbeing * 76.3 76 * 74.9 75 Normal Range 73.9 74 73.0 73 71.7 72 71 <$15 $15-30 $31-60 $61-90 $91-120 $121-150 $150+ Median Household Income ($'000) Beyond a certain income there is no further benefit to subjective wellbeing
B.Subjective Social Indicators be used---to identify geographic areas that require additional resources
Parliament House in Canberra In 2005 we compared the Subjective Wellbeing of the 150 Federal electorates
New South Wales Above average Average Below average
Summary Both objective and subjective social indicators provide important and different information Objective Social Indicators e.g. National wealth Subjective Social Indicators e.g. Subjective Wellbeing Both sources of information used to make policy decisions Optimization of Social Development according to the availability and distribution of resources